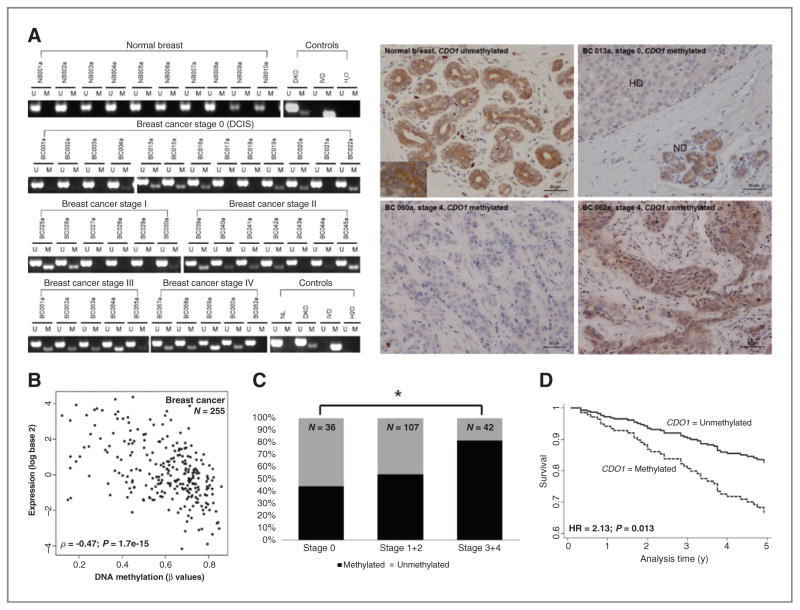
Figure 2.
DNA methylation-associated silencing of CDO1 is cancer specific, frequent, and correlates with disease progression and outcome. A, DNA methylation and protein expression status of CDO1. CDO1 promoter region from −168 bp to −45 bp relative to the TSS was assayed by MSP in a cohort of 20 normal breast tissues from non–cancer patients and 185 primary breast cancers (BC) of stages 0 (DCIS) to 4 with U and M marking unmethylated and methylated bands, respectively. Representative examples are shown for each cohort and each tumor stage. In vitro methylated DNA (IVD), DKO cells, normal lymphocytes (NL), and H2O controls were assayed along with samples. Protein expression status of CDO1 was assayed by immunohistochemistry in normal breast and selected primary breast cancers. Note, BC013a, a DCIS sample, displays loss of CDO1 expression in hyperproliferative ductuli (HD) but expression of CDO1 in normal ductuli (ND). B, scatter plot depicting correlation between expression log2 values (y-axis; analyzed on Agilent 244 K Custom Gene Expression G4502A-07 platform) and DNA methylation β values (x-axis; analyzed on Illumina HumanMethylation 27k platform) of CDO1 in 255 primary breast cancers from TCGA data portal. A Spearman correlation coefficient of ρ = −0.47 and P value of 1.7e-15 were calculated. A P < 0.05 was considered statistically significant. C, DNA methylation frequency (in%) of CDO1 plotted by tumor stage of 185 primary breast cancers. CDO1 methylation status and tumor stage were correlated using Pearson χ2 test. *, P < 0.05. D, survival curve depicting prognostic value of CDO1 methylation status for outcome prediction in 185 primary breast cancers. HR for prognostic value was calculated using univariate Cox proportional hazards regression model.

