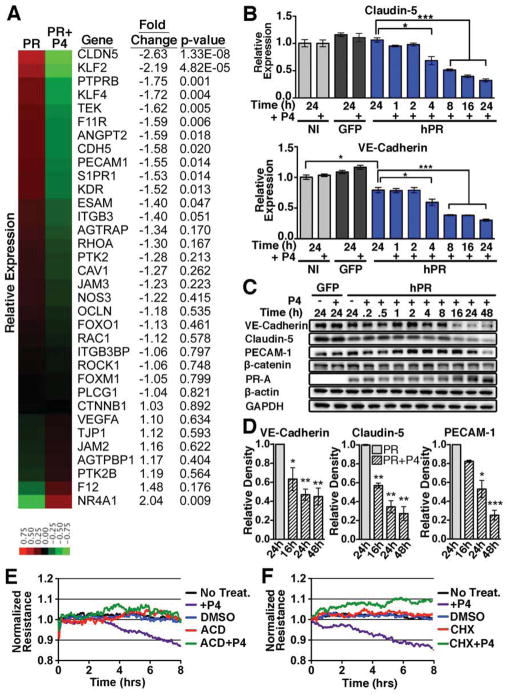
Figure 5. PR activation leads to changes in expression of junctional proteins.
(A) Heat map representing the relative expression and fold change of genes known to regulate vascular permeability in PR vs. PR+P4 HUVECS at 4h. (B) qPCR of VE-cadherin (CDH5) and claudin-5 (CLDN5) expression following P4 treatment of non-infected (NI), GFP infected (GFP) and PR infected (hPR) HUVECs. n=3. GFP infected HUVECs were used as a control for infection. (C) Western blot analysis of total protein levels from GFP control or PR infected HUVECs following P4 treatment. GAPDH/β-actin=loading controls. Blots are representative of three independent experiments. (D) Densitometry of VE-cadherin, claudin-5, and PECAM-1 protein levels following P4 treatment. n=3. (E,F) Evaluation of HUVEC monolayer resistance following treatment with cycloheximide (CHX, 10μg/ml), actinomycin D (ACD, 10μg/ml), or P4 and vehicle as indicated. Error bars=+/− SEM. *p<0.05, **p<0.01, ***p<0.001. See also Figure S5.

