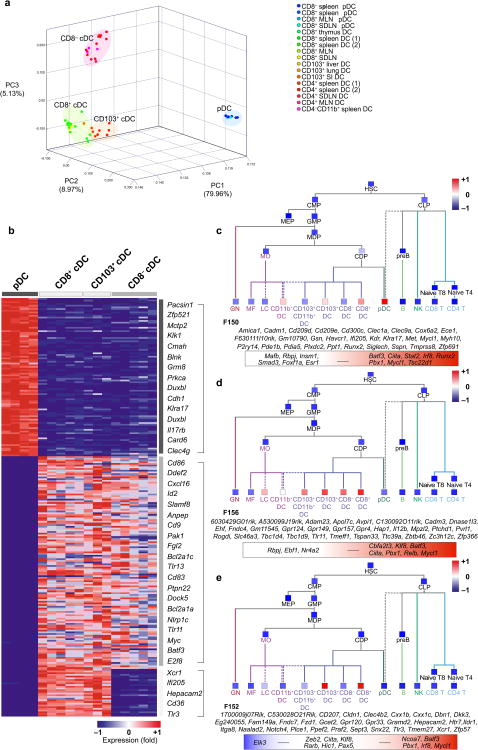
Figure 3.
Unique gene signatures characterize distinct tissue DC clusters. (a) PCA of the top 15% most variable genes across pDC, CD8+ cDC, CD8− cDC and CD103+ cDC transcripts. Replicates are shown. (b) Heat map exhibits transcripts significantly (t-test FDR ≤ 0.05) up-regulated by at least two-fold and not expressed in the exclusion population according to the QC95 value in pDC vs cDC, cDC vs pDC, and CD8+/CD103+ cDC vs pDC/CD8− cDC. Representative genes are listed on the right. Full list is provided in Table S1. Red represents high relative expression, while blue represents low relative expression. (c–e) ImmGen fine modules consisting of highly co-expressed transcripts and Ontogenet predicted regulators were extracted from the expression dataset representing all hematopoietic cells. Projection of (c) Module F150, (d) Module F156, and (e) Module F152 across the immgen data and mean expression of each module is shown (red colored squares represents high expression, while blue represent low relative expression). The genes expressed in each module are listed in italics below and predicted regulators are displayed in the color box. Red represents predicted activators, while blue represents predicted repressors. MLN: mesenteric LN; SDLN: skin draining LN; SI: small intestine. *Replicates n ≥3 unless listed otherwise in Table 1.

