Figure 4.
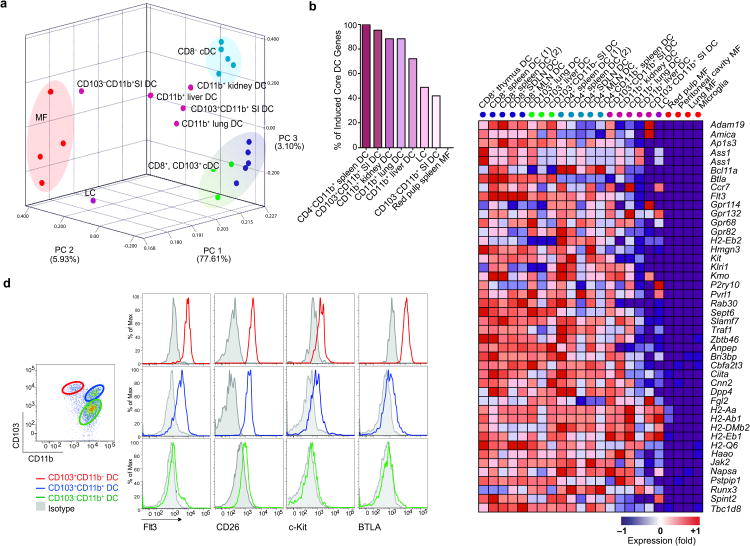
Non-lymphoid tissue CD11b+ cDC are heterogeneous. (a) PCA of the top 15% most variable transcripts expressed by lymphoid tissue CD8+ cDC, CD8− cDC, non-lymphoid tissue CD103+ cDC, non-lymphoid tissue CD11b+ cDC, epidermal LC and MF. Population means are shown. Population color labels displayed next to heatmap column labels of Fig 4c. (b) Graph show percentages of core cDC transcripts (identified in Fig. 2) that are up-regulated (FC≥2) in CD11b+ cDC subsets and red pulp MF. (c) Heat map indicates the relative expression of cDC and MF transcripts in each cDC population. Red represents high relative expression, while blue represents low relative expression. (d) Small intestine single cell suspensions were analyzed by flow cytometry for core cDC genes. Dot plot shows the expression of CD103 and CD11b on DAPI−CD45+CD11c+MHCII+ lamina propria cDC. Histograms show the expression of Flt3, CD26, c-Kit, and BTLA among CD103+CD11b− cells, CD103+CD11b+ F4/80− cells and CD103+CD11b+ F4/80+ cells. Data shown are representative of three different experiments. MLN: mesenteric LN; SDLN: skin draining LN; SI: small intestine. LC: Langerhans cells.. *Replicates n ≥3 unless listed otherwise in Table 1.

