Figure 5.
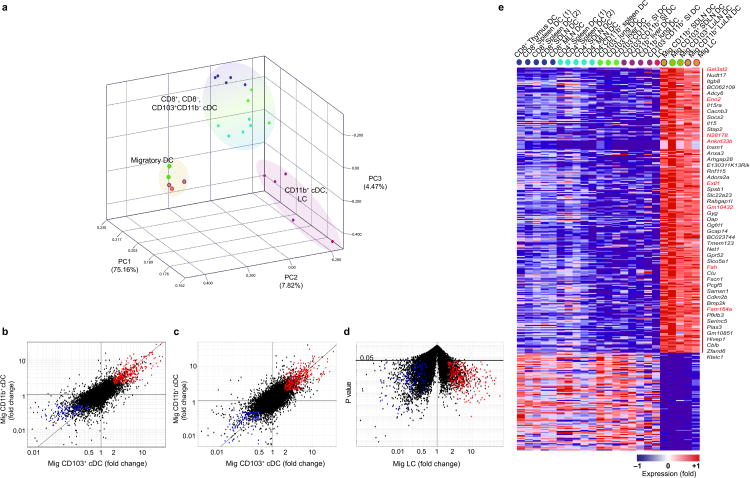
Tissue migratory cDC up-regulate a unique gene signature regardless of tissue or cellular origin. (a) PCA of top 15% most variable transcripts expressed by lymphoid tissue resident CD8+ cDC and CD8− cDC, non-lymphoid tissue CD103+ cDC, non-lymphoid tissue CD11b+ cDC, epidermal Langerhans cells (LC), migratory (Mig) LC isolated from the skin draining LN, and migratory CD103+ and CD11b+ cDC isolated from skin-draining and lung-draining LN. Population means are shown. Fold change-fold change comparison of gene expression between (b) migratory CD103+ cDC and CD11b+ cDC and non-lymphoid tissue resident CD103+ and CD11b+ cDC, (c) migratory CD103+ cDC and CD11b+ cDC compared to lymphoid tissue resident CD8+ cDC and CD8− cDC, and (d) migratory LC versus epidermal LC. Red highlights transcripts significantly (FC≥2; t-test p≤ 0.05) increased by at least two–fold, whereas blue highlights those significantly decreased (FC≤ 0.5; t-test p≤ 0.05) in all population comparisons. (e) Heat map representation of the transcripts in fold-change fold-change plots from (b-d). Genes listed to the right are up-regulated by at least five-fold. Transcripts not expressed in steady state tissue cDC according to the QC95 value in migratory DC vs resident cDC are highlighted in red. Genes in heatmap are listed in Table S2. In heatmap, red represents high while blue represents low relative expression LuLN: lung draining LN; SDLN: skin draining LN; SI: small intestine, LC: Langerhans Cell. *Replicates n ≥3 unless listed otherwise in Table 1.

