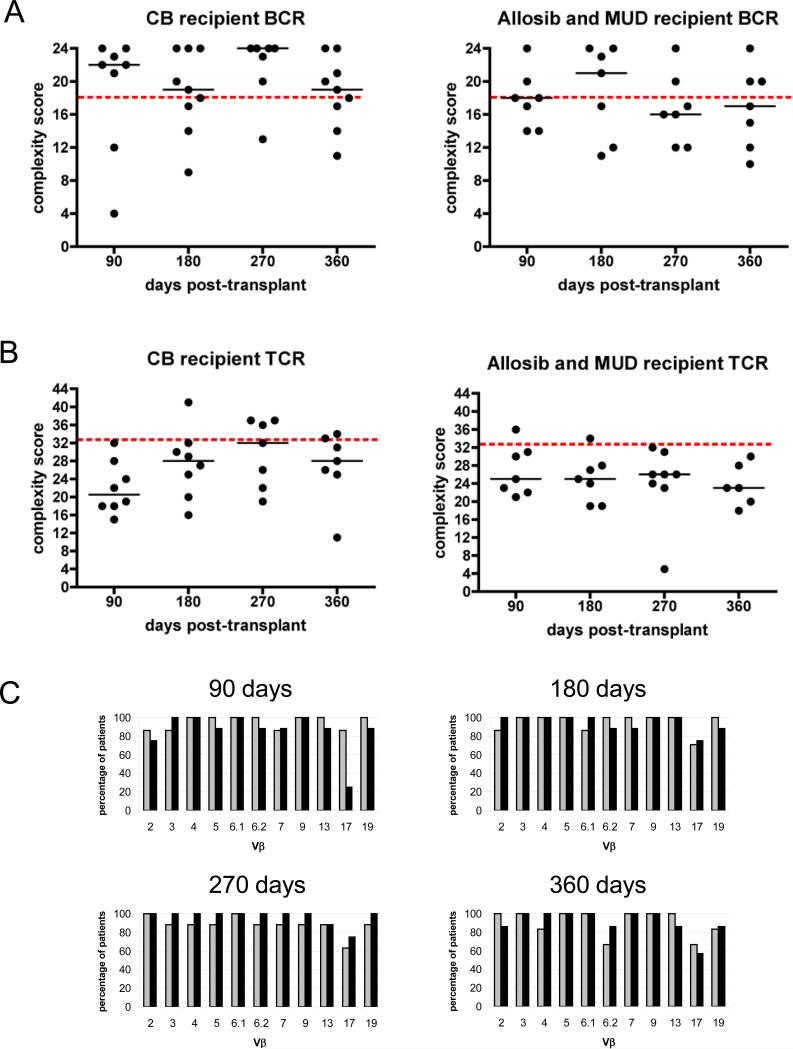
Figure 4. CDR3 spectratype analysis of peripheral blood lymphocytes from patients that underwent hematopoietic stem cell (HSC) transplantation.
CDR3 spectratype analysis of the BCR repertoire (A) and TCR repertoire (B) from CB transplant recipients (left panels) and from patients receiving stem cells from an allogeneic sibling (allosib) or matched unrelated donor (MUD) (right panels). A complexity score was calculated by summing the individual diversity scores for each BCR or TCR family. The BCR repertoire was considered well-diversified if the complexity score was >18 (score of at least 3 for all 6 VH families), and the TCR repertoire was considered well-diversified if the complexity score was >33 (score of at least 3 for all 11 Vβ families); the dashed lines indicate the minimum score of a well diversified repertoire. The horizontal lines indicate the median. (C) The percentage of allosib and MUD patients (light bars) and the percentage of CBT patients (dark bars) with T cells utilizing each of the 11 Vβ families analyzed is shown at 90 days (allosib and MUD n=7, CB n=8), 180 days (allosib and MUD n=7, CB n=8), 270 days (allosib and MUD n=8, CB n=7), and 360 days (allosib and MUD n=6, CB n=7) post-transplant.

