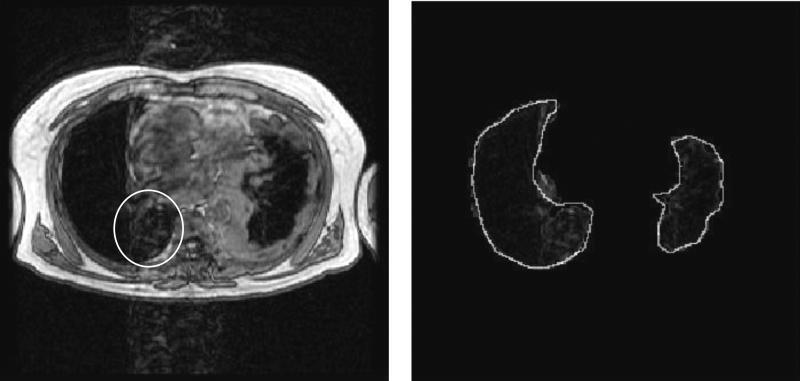
FIG. 7.
Example of a typical segmentation result from the complete method. The left image is the original artifact corrupted image and the right is the resulting automated lung segmentation with a radiologist outline superimposed (white outline). Note that window and level have been set to illustrate the presence of cardiac motion artifact. Also note that lung regions severely impacted by cardiac motion artifact have been properly segmented (oval).

