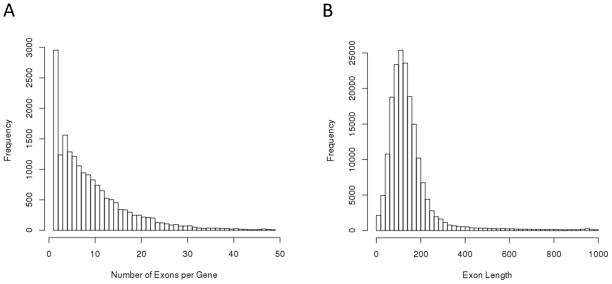
Figure 1.
Histograms depicting distributions of (A) number of exons per gene and (B) individual exon length for ~180,000 exons constituting 18,305 genes in CCDS data for the hg19 human genome build. The right tails of each figure are censored, excluding approximately with 0.8% and 1.5% of the distributions, respectively.

