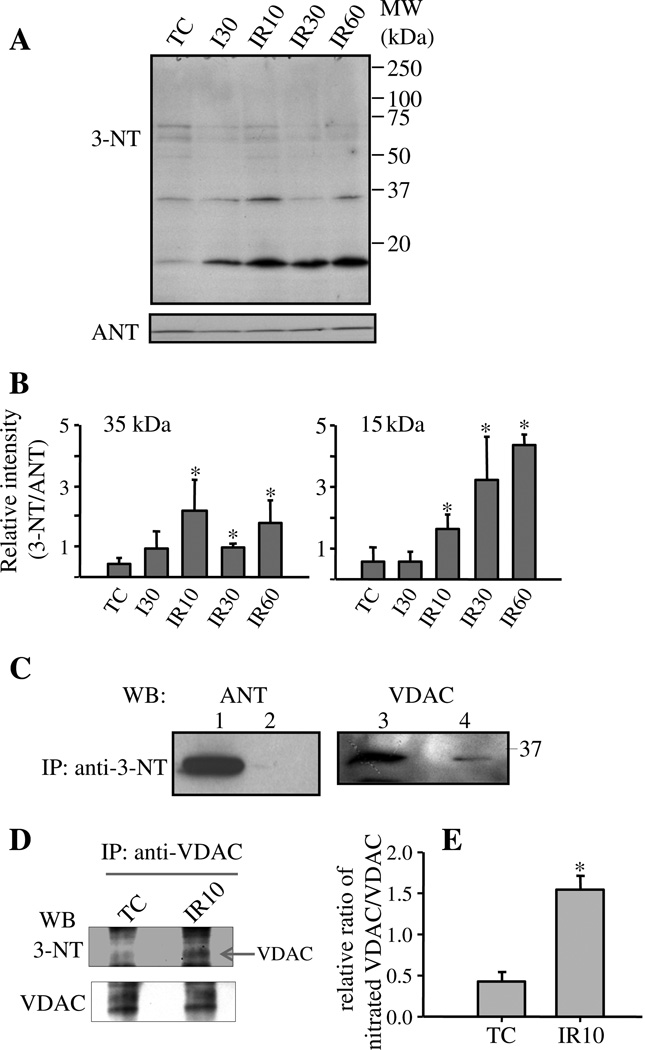
Fig. 2.
Assessment of tyr-N of mitochondrial proteins isolated from hearts and identity of tyr-N mitochondrial proteins. A: Assessment of tyr-N of cardiac mitochondrial proteins fromTC and IR groups hearts by Western blot with anti-3-NT antibody. Amounts of loaded mitochondrial proteins were monitored with anti-ANT antibody. B: Densitometric analysis of Western blot of tyr-N of mitochondrial proteins. The densities of anti-3-NT bands at about 35 kDa and 15 kDa, and ANT bands were measured using ImageJ system, after which % density of each anti-3-NT bands was normalized to % density of their corresponding ANT bands. A is a representative blot and B is the mean ± SEM of four experiments. *: p < 0.05 vs. TC group. TC: time control; I: Ischemia; R: Reperfusion. MW: molecular weight. C: Mitochondrial proteins isolated from IR groups were subjected to IP with anti-3-NT antibody followed by Western blots with indicated antibodies. Lanes 1 and 3: total mitochondrial protein lysates (input); lanes 2 and 4: IP with anti-3-NT antibody. MW: molecular weight; WB: Western blot. D: VDAC from mitochondrial protein of TC and IR10 groups was first individually immunoprecipitated with anti-VDAC antibody. The immunoprecipitates were subjected to Western blotting with anti-3-NT antibody and then the membrane was stripped and reblotted with anti-VDAC antibody. E: Densities of anti-3-NT bands and VDAC bands in TC and IR10 groups were measured using ImageJ system, after which % density of each anti-3-NT bands was normalized to % density of their corresponding VDAC bands. WB: Western blot. D is a representative blot and E is the mean ± SEM of three experiments. *: p < 0.05 IR10 vs. TC.

