Figure 8.

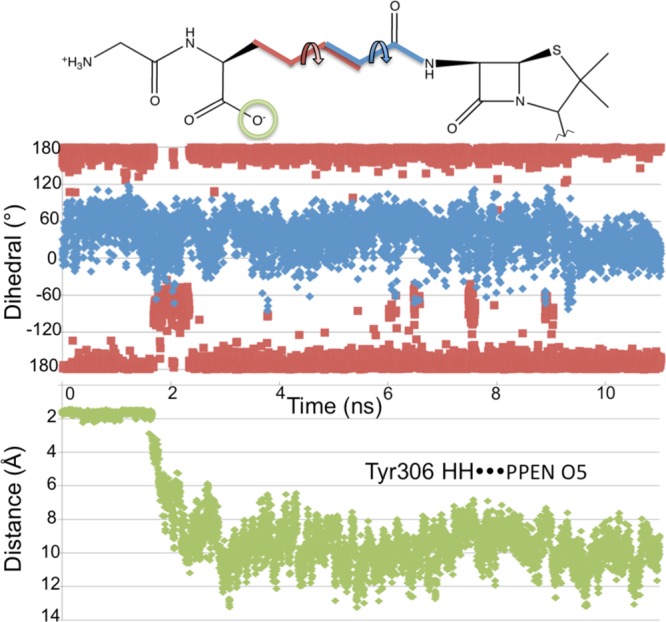
Top: Dihedral angles are measured for the 11 ns PPEN–R61 MD simulation, which are denoted by D1 (black) and D2 (gray). Bottom: the hydrogen bond distance between Tyr306HH···PPEN O5 is measured for the 11 ns PPEN–R61 MD simulation.

Top: Dihedral angles are measured for the 11 ns PPEN–R61 MD simulation, which are denoted by D1 (black) and D2 (gray). Bottom: the hydrogen bond distance between Tyr306HH···PPEN O5 is measured for the 11 ns PPEN–R61 MD simulation.