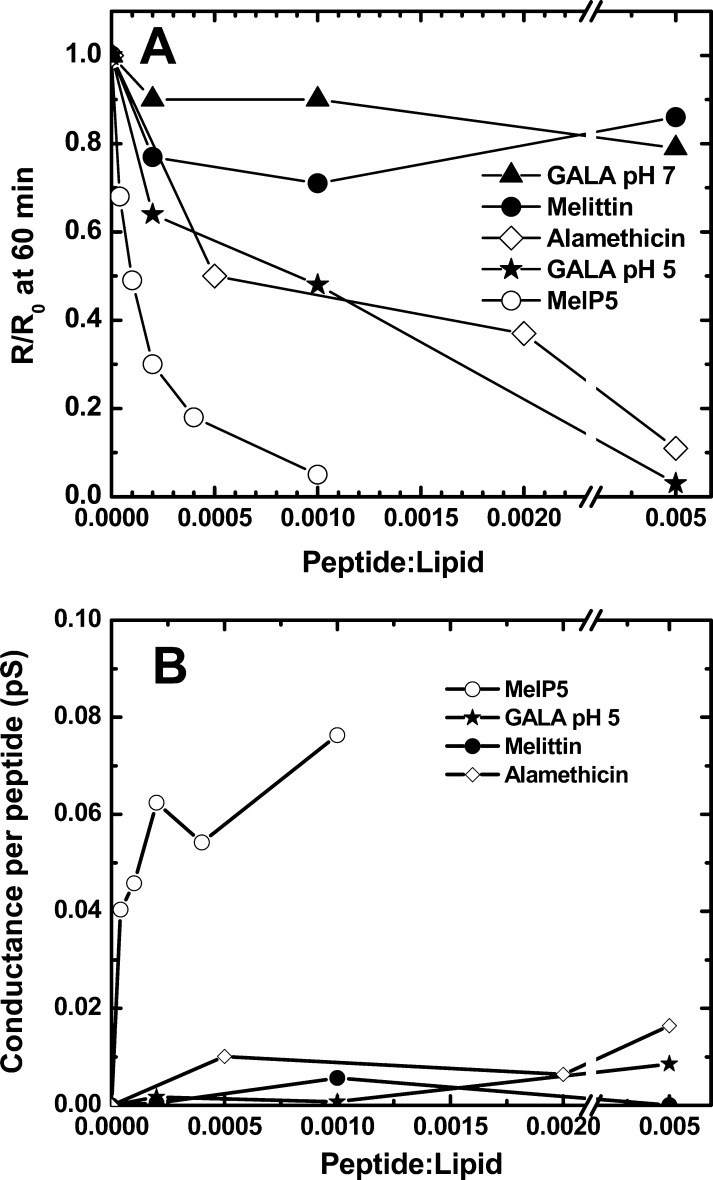
Figure 6.
Comparison of bilayer response to peptides. (A) The equilibrium reduction in normalized bilayer resistance is shown for each of the peptides studied here. Each point is the bilayer resistance measured at the 60 min time point of EIS experiments, relative to the resistance before peptide addition. (B) The peptide-induced change in membrane conductance between 0 and 60 min, calculated and then normalized to the number of peptides in the 1 cm2 area of the supported bilayer.

