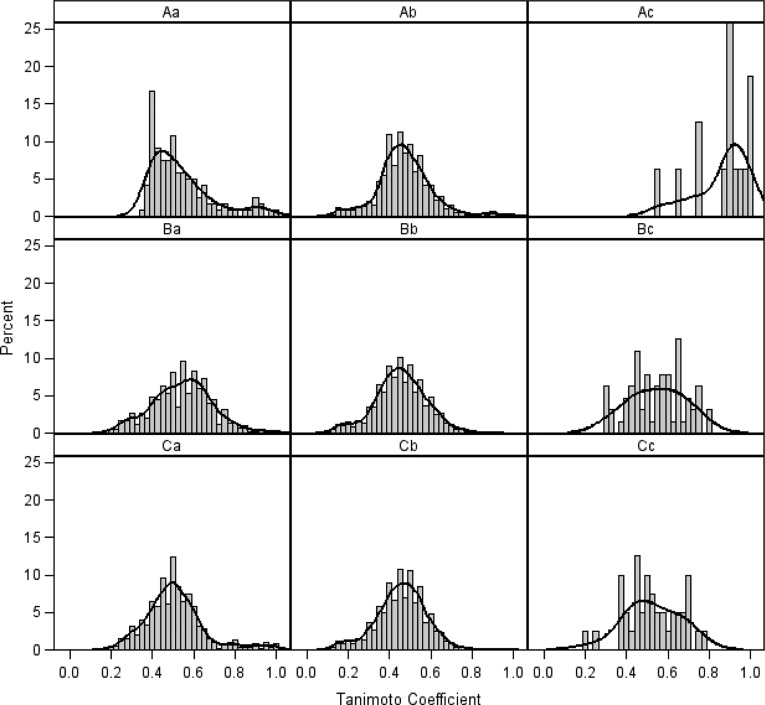
Figure 5.
The distribution of the pairwise structural similarity within the sets of screening hits from three types of libraries in comparison to modeling sets using the kernel density plot for Tc distribution: Aa, between hits from the Prestwick library; Ab, between the Prestwick hits and all modeling set compounds; Ac, between the Prestwick hits and their nearest neighbors in the modeling set. Ba, Between TimTec GPCR-targeted library hits; Bb, between the TimTec GPCR-targeted library hits and all modeling set compounds; Bc, between the GPCR-targeted library hits and their nearest neighbors in the modeling set. Ca, Between TimTec diversity library hits; Cb, between the TimTec diversity library hits and all modeling set compounds; Cc, between the TimTec diversity library hits and their nearest neighbors in the modeling set.

