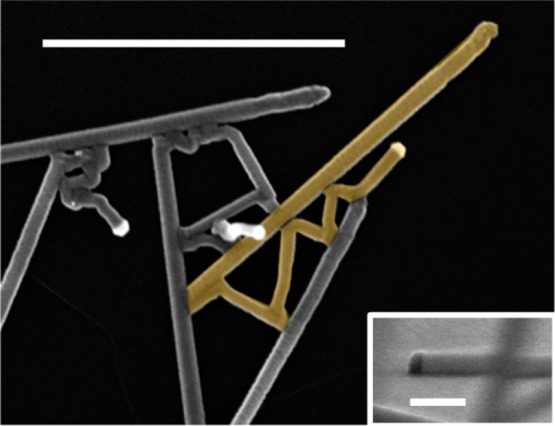
Figure 3.

In-plane GaP NW growth. Top view SEM image, scale bar 1 μm. One NW has been false-colored for clarity. The inset shows a grazing incidence SEM image of a NW from the same sample, showing the interface between the seed particle (dark) and the NW. Note that the NW in the inset is not completely orthogonal to the viewing direction, which makes the interface seem slightly tilted.
