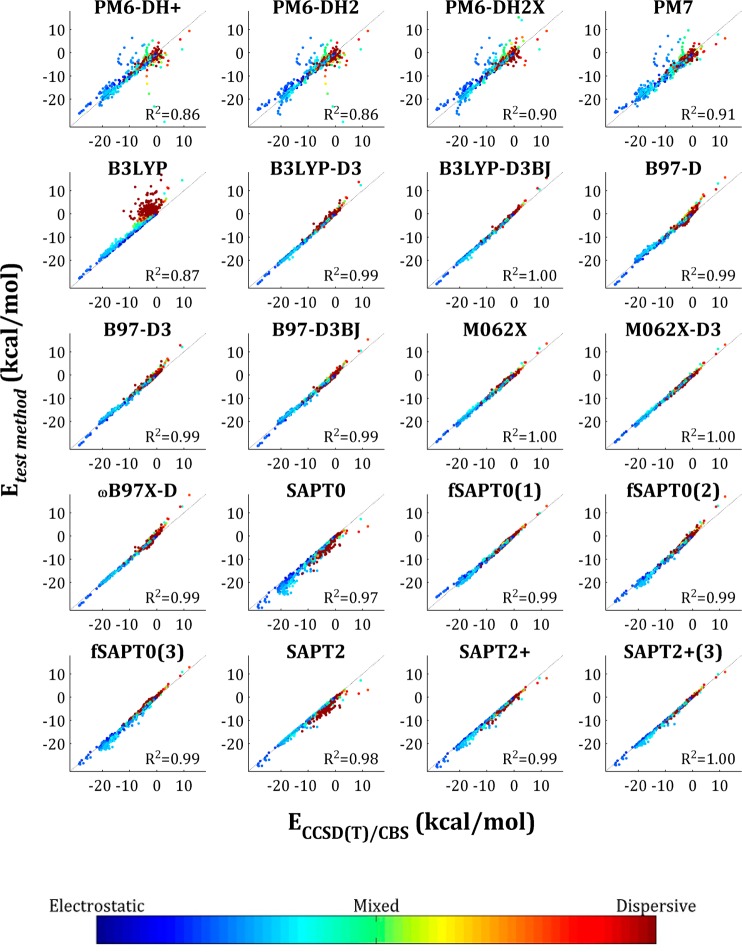
Figure 3.
Correlation of QM methods with CCSD(T)/CBS CP. We present only those data sets to which all methods could be applied, i.e., A24, Ionic, S22×5, S66×8, and X31×10. Each entry is colored by interaction type character (see spectrum below), which is defined as |Edisp/Eelst|, where Edisp and Eelst are the total electrostatic and dispersion energy components taken from the SAPT2+(3) calculations.

