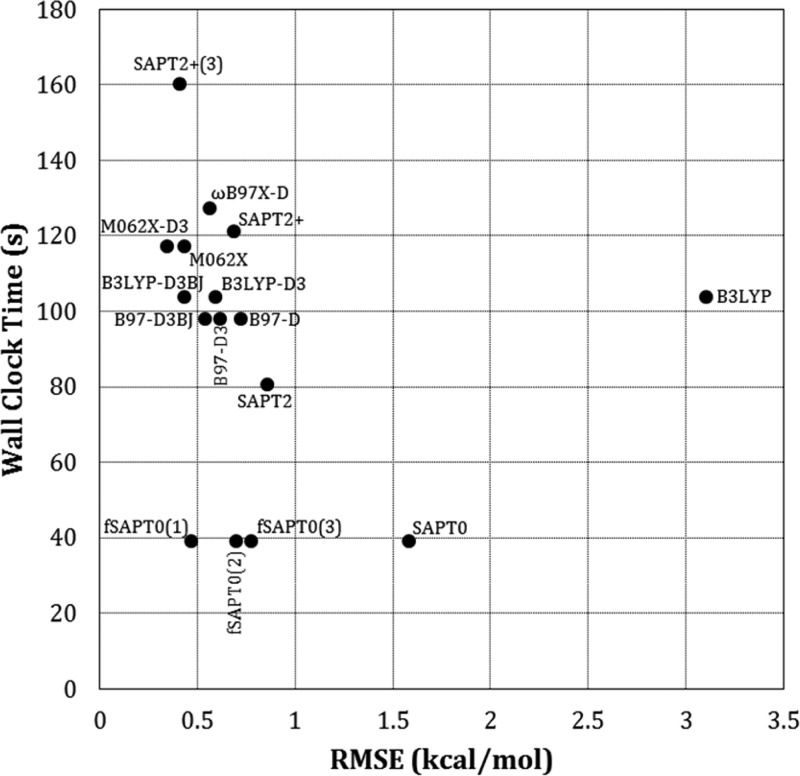
Figure 6.
Trade-off between accuracy and calculation time. Accuracies are presented as RMSE across the A24, Ionic, S22×5, S66×8, and X31×10 data sets, while calculation times are averaged for the A24 data set alone. Note that the post hoc D3 dispersion corrections and the SAPT0 fitting require negligible calculation time.

