
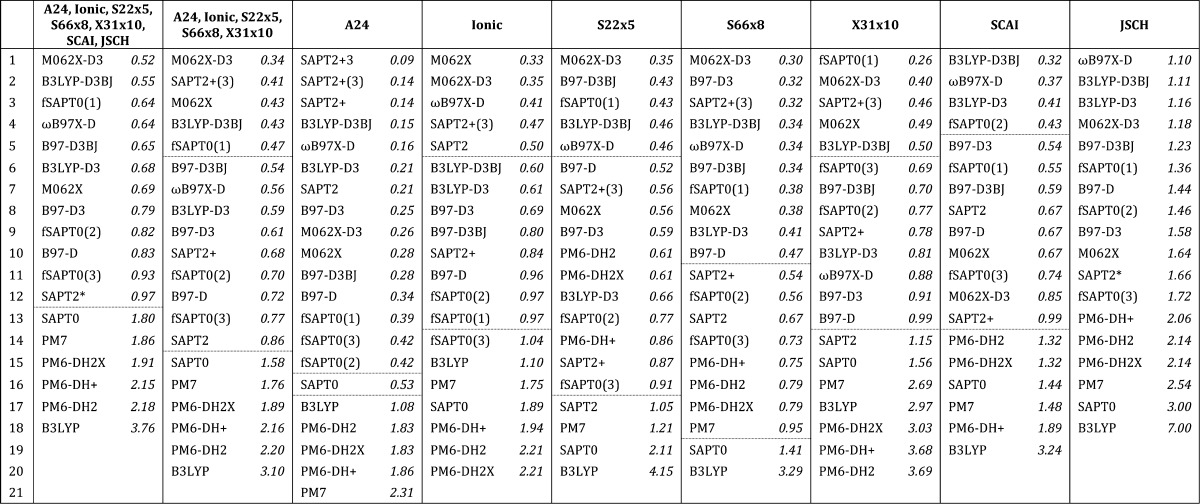
Table 2. Ranking of QM Methods by RMSE (kcal/mol) for Combined and Individual Benchmark Data Setsa.
a
Dashed lines mark RMSE levels of 0.50 and 1.00 kcal/mol. Higher orders of SAPT calculations were not completed for some data sets due to memory limitations. A24 was evaluated at orders through SAPT2+3, SCAI through SAPT2+, JSCH through SAPT2, and all other data sets through SAPT2+(3).
*
SAPT2 calculations were only evaluated for 134 out of 143 of the JCSH systems.