
Figure 1.
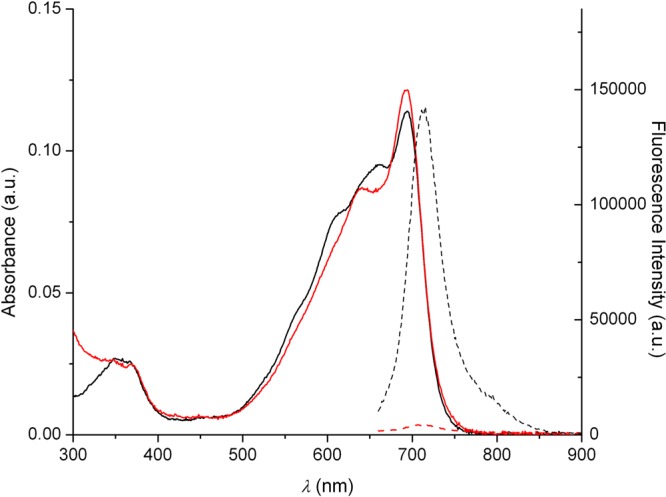
Fluorescence (dotted lines) and absorbance (solid lines) spectra of DHX1 (black lines) and CuDHX1 (red lines) in aqueous buffer (50 mM PIPES, 100 mM KCl, pH = 7).
Official websites use .gov
A
.gov website belongs to an official
government organization in the United States.
Secure .gov websites use HTTPS
A lock (
) or https:// means you've safely
connected to the .gov website. Share sensitive
information only on official, secure websites.
Fluorescence (dotted lines) and absorbance (solid lines) spectra of DHX1 (black lines) and CuDHX1 (red lines) in aqueous buffer (50 mM PIPES, 100 mM KCl, pH = 7).