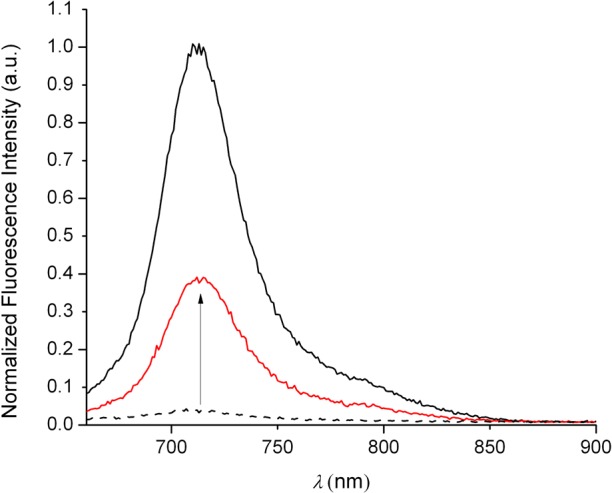
Figure 2.

Fluorescence spectra of 2 μM CuDHX1 (black dashed line) in aqueous buffer (50 mM PIPES, 100 mM KCl, pH = 7) and 2 min after the addition of 100 equiv of Angeli’s salt (red solid line). The black solid line is the spectrum of ligand DHX1. λex: 650 nm.
