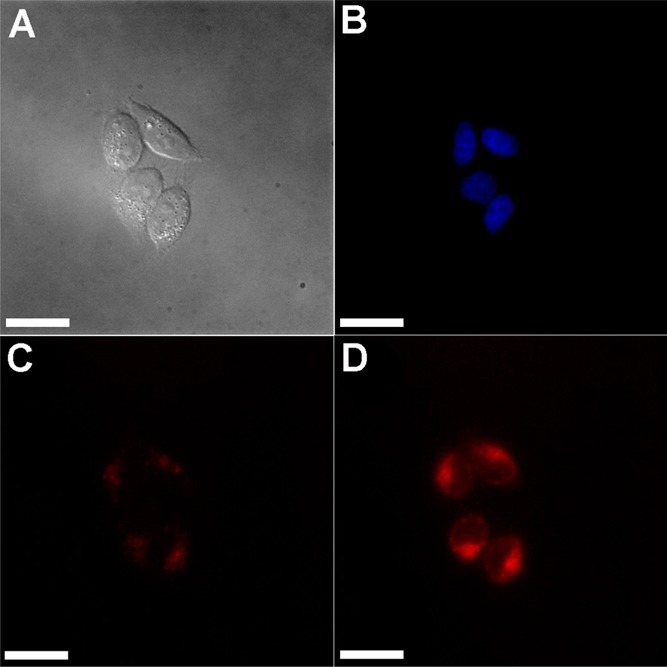
Figure 5.

Fluorescence microscopy images of cells incubated with CuDHX1 in PBS before and after addition of Angeli’s salt: (A) Differential interference contrast (DIC) image; (B) blue channel showing nuclei; (C) NIR channel before addition of Angeli’s salt; and (D) NIR channel 5 min after treatment with 1.5 mM Angeli’s salt. Scale bar =25 μm.
