
Scheme 1. Reaction-Coordinate Diagrams for Alternate Ordering of the Monomer-Generating-Reaction and Crystal-Nucleation Barriers.
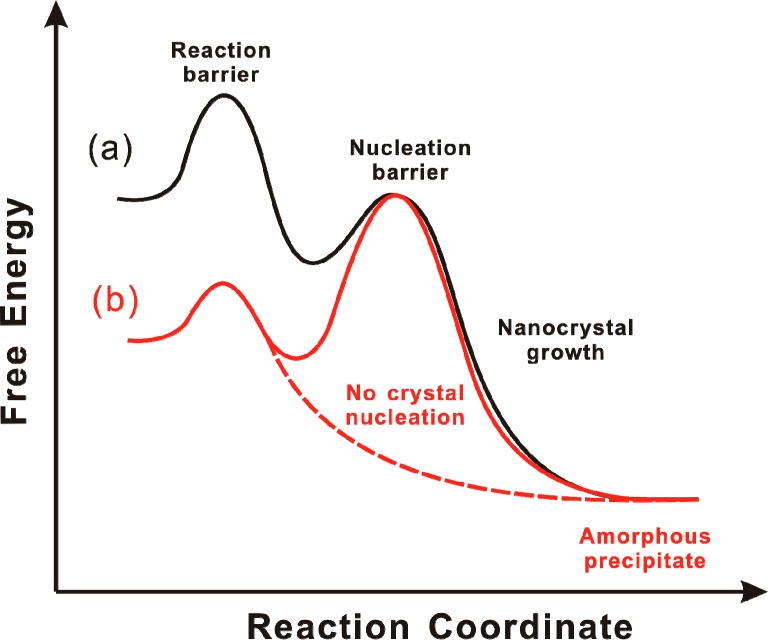
(a) The reaction barrier is higher than the nucleation barrier, and nanocrystal growth occurs on the black free-energy curve. (b) The reaction barrier is lower than the nucleation barrier, precluding nucleation and crystal growth. Instead, amorphous aggregates are formed on the red dashed curve.