
Figure 1.
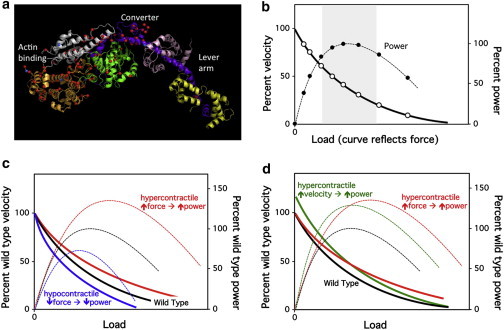
The myosin motor domain, the force-velocity curve, and power output. (a) Image of the poststroke state crystal structure of a muscle myosin motor domain (cardiac human myosin S1dC, β-isoform complexed with Mn-AMPPNP. V. A. Klenchin, J. C. Deacon, A. C. Combs, L. A. Leinwand, and I. Rayment; 4DB1 crystal structure in the RCSB database. Mutation information is from the MYOMAPR database; Buvoli 08 is the reference for those). The actin-binding, converter, and lever-arm domains are indicated. The length of the globular head from the actin-binding domain to the end of the converter is 9 nm, and from the end of the converter to the end of the lever arm is 8 nm. Representatives of reported HCM mutations (red dots) and DCM mutations (blue dots) are shown (14). (b) The hyperbolic solid line (open circles) refers to how the velocity changes as a function of the load imposed on the contractile machinery. The shape of the curve depends on how much force the contractile machinery can produce. At any velocity along the curve, the ensemble force of the system matches the equal and opposite load imposed. Power output is the force times the velocity at every point along the curve (dashed line, solid circles). (Gray zone) Region of high power output. (c) The higher force-producing hypercontractile-causing mutant forms of the contractile apparatus (solid red F-v curve; dashed red power curve) require more load to slow the contraction, and a higher power-output results. The reverse is expected for the hypocontractile-causing mutant forms (solid blue F-v curve; dashed blue power curve). (d) The force-velocity curve can be changed in two fundamental ways by hypercontractile-causing mutations: 1), The force can be increased (solid red F-v curve), resulting in increased power output (dashed red curve). 2), The velocity can be increased even in the absence of any force change (solid green curve), also resulting in increased power output (dashed green curve). Hypercontractile-causing mutations can also, of course, lead to changes in both ensemble force and velocity. To see this figure in color, go online.