
Figure 5.
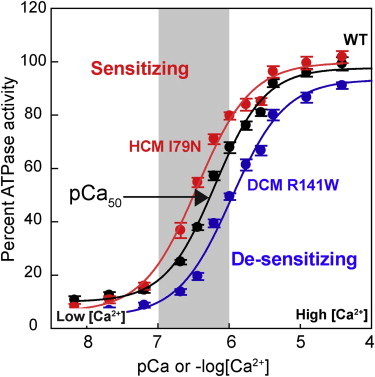
Assay for activation of myosin ATPase activity by the regulated actin thin filament as a function of free Ca2+ concentration. The in vitro generated curves mimic well the expected pCa range operating in cardiac muscle (gray zone); actually, under normal everyday conditions of behavior, the human heart seldom reaches even halfway up this curve. The two mutations shown are troponin T mutations and the assays were carried out using expressed human β-cardiac myosin S1 (data from Sommese et al. (82)). To see this figure in color, go online.