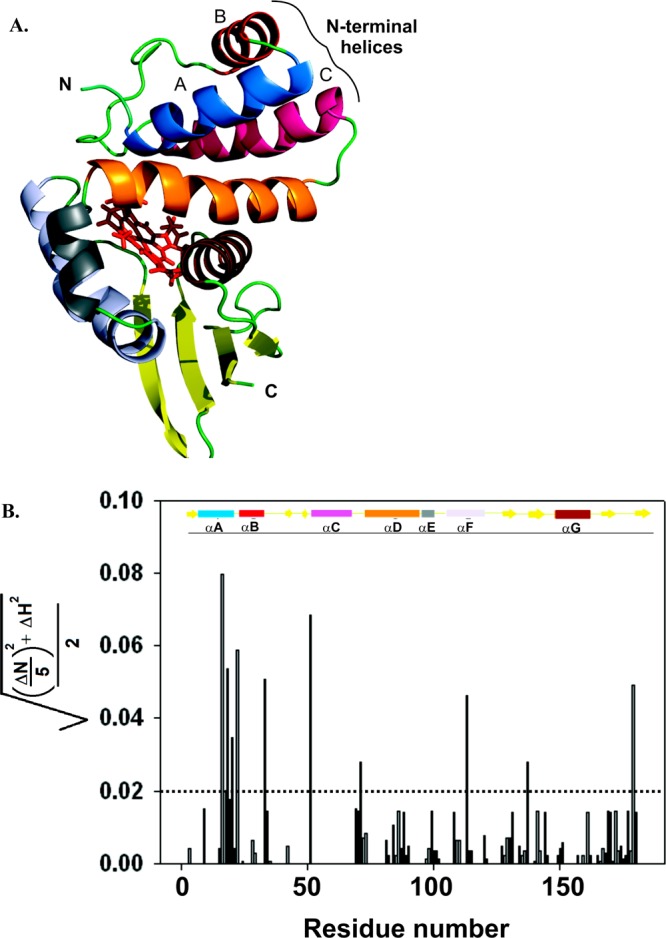
Figure 3.

(A) Ribbon structure of the SwH-NOX protein from S. woodyi. This figure is a homology model generated in PyMOL using the solution-state NMR structure of Shewanella oneidensis(26) (So2144, Protein Data Bank entry 2KII, chain A). The heme is shown as red sticks. The N- and C-termini of the protein are denoted. The seven different helices are depicted in different colors: blue for helix αA, red for helix αB, hot pink for helix αC, orange for helix αD, gray for helix αE, purple for helix αF, and chocolate brown for helix αG. (B) Chemical shift changes for SwH-NOX upon addition of SwHaCE. The shifts (SwH-NOX to SwH-NOX/SwHaCE), calculated as {[(ΔN/5)2 + (ΔH)2]/2}1/2, are plotted against the primary sequence residue number. The cutoff shift was kept at 0.02, and shifts above 0.02 (dashed line) were considered significant. The secondary structure of SwH-NOX is shown as a cartoon in which the rectangles represent α-helices and the solid arrows represent β-strands. The color code corresponds to the ribbon diagram in panel A.
