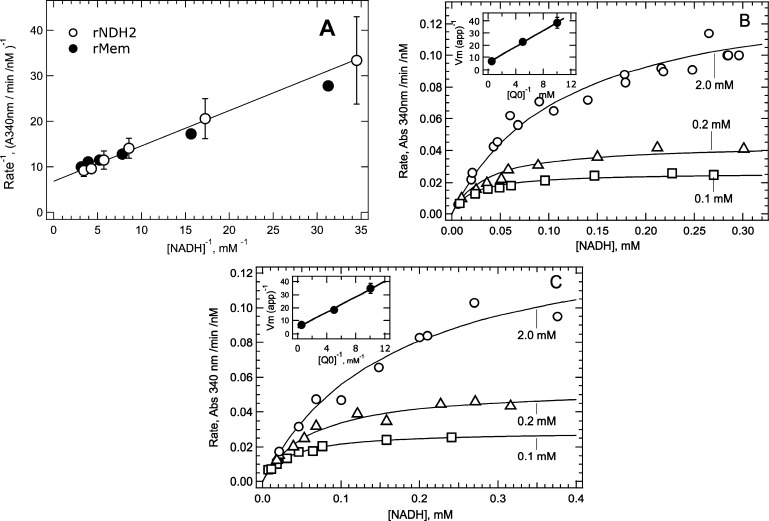
Figure 1.
Kinetic analysis of NADH-UQ0 reduction by membrane-bound and purified (soluble) Mtb NDH-2. (A) Double-reciprocal plots of the initial velocity vs substrate concentration where both substrates were varied while maintaining a constant ratio of [UQ0] = 6.25[NADH]. The line through the data is the fit of soluble Mtb data to eq 2. Error bars show the range from duplicate experiments. (B) Analysis of NADH-UQ0 kinetics with soluble NDH-2. Initial velocities were determined with NADH as the varied substrate and three different concentrations of UQ0 as the fixed substrate. Lines through the data were determined by global fitting of the three data sets to eq 4. Insets represent secondary plots used to determine Vmax for the reaction and KM values. (C) Plots are similar to those in panel B but were obtained using membranes isolated from M. smegmatis overexpressing recombinant Mtb NDH-2.

