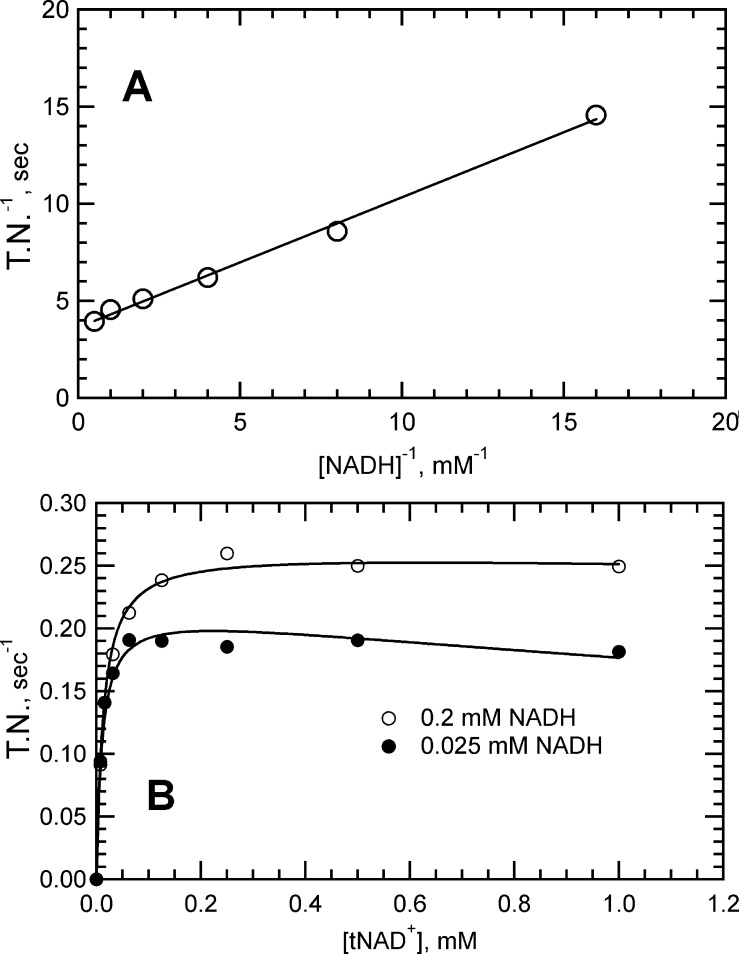
Figure 3.
NADH-tNAD+ transhydrogenase reaction catalyzed by soluble Mtb NDH-2. Initial velocity data converted to turnover numbers (TNs) as described in Experimental Procedures. (A) Double-reciprocal plots of velocity vs substrate concentration data where substrates were maintained at a fixed ratio of [NADH] = [tNAD+]. The reaction mixture contained 40 nM NDH-2. (B) Initial velocity vs substrate concentration plots to obtain kinetics of the transhydrogenase reaction. The reaction mixture contained 48 nM NDH-2, varying concentrations of tNAD+, and 200 μM NADH (○) or 25 μM NADH (●). Solid lines through the data were produced from global fits to eq 4 modified with a term to account for substrate inhibition.

