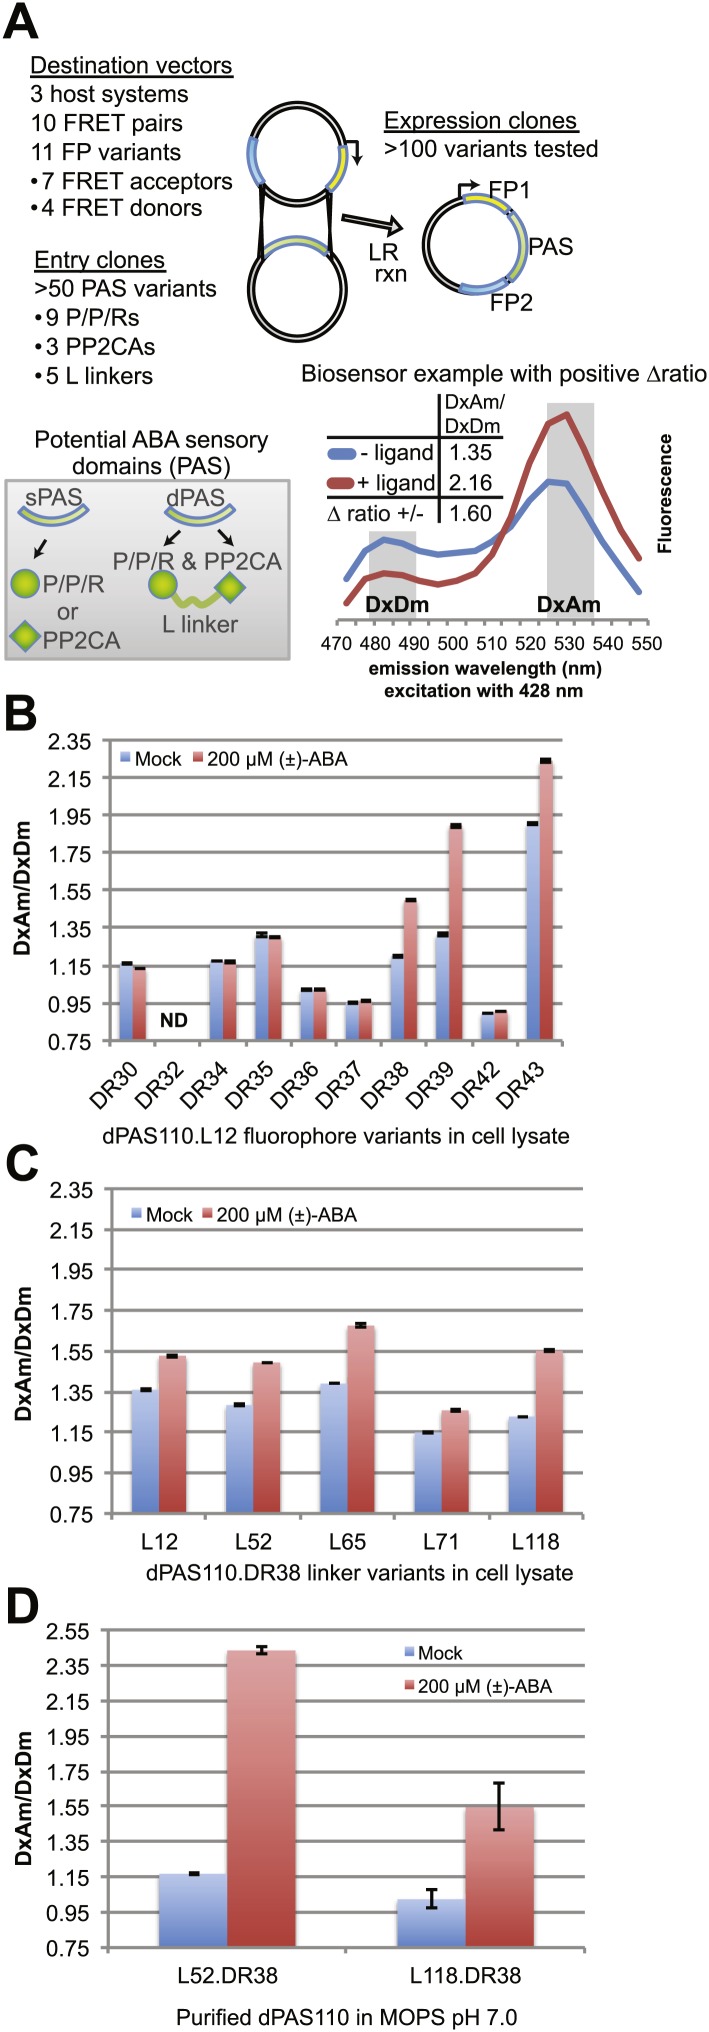
Figure 1. ABA responses of potential FRET sensors expressed in yeast and tested in yeast cell lysates or as purified proteins.
(A) Diagram of cloning strategy based on pDR FLIP Destination vectors encoding FRET fluorescent protein pairs and PAS Entry clones encoding sPAS or dPAS ABA sensory domains. Also shown is an example of fluorescence emission curves without and with ligand for a sensor [ABACUS1-80µ, see below] with a positive ratio change (Δ DxDm/DxAm) of 1.6. (B) One linker variant (L12) of one dPAS (110) combined with nine fluorescent protein pairs. (C) Five linker variants of one dPAS combined with one fluorescent protein pair. (D) Two linker variants of one dPAS combined with one fluorescent protein pair tested as purified proteins. DxAm/DxDm = acceptor emission with donor excitation over donor emission with donor excitation. dPAS = double putative ABA sensory domain.


