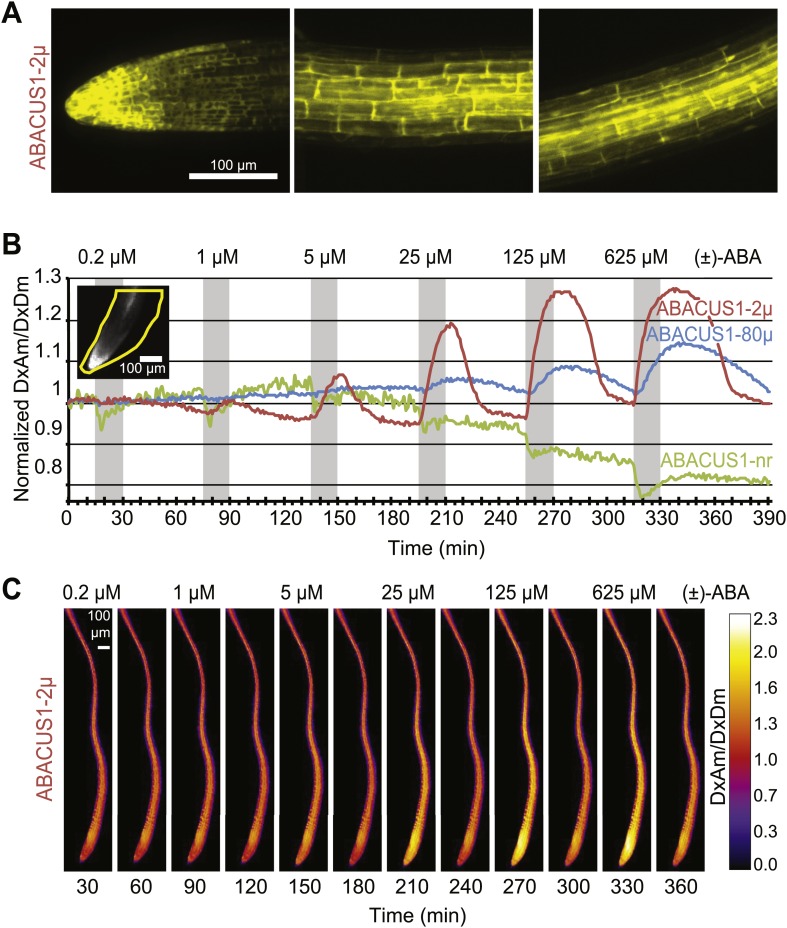
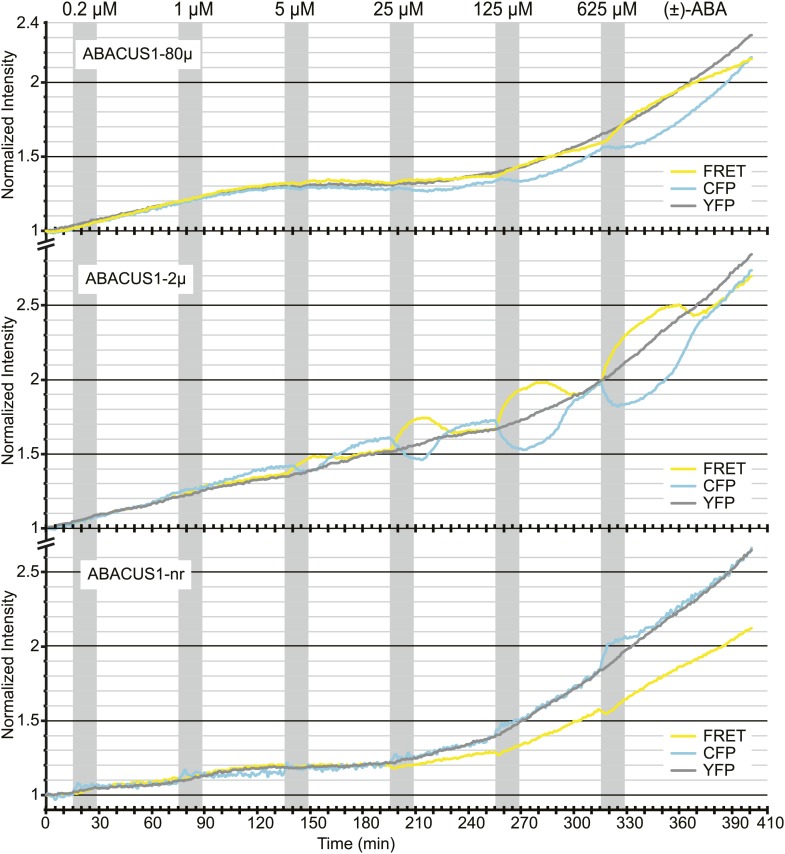
Figure 6. Expression pattern and ABA responses of ABACUS1 in Arabidopsis roots.
(A) Expression pattern and cytosolic localization of ABACUS1-2µ fluorescence (AxAm) in root cells in the root tip (left), in the elongation zone (center), and in the differentiation zone (right). (B) ABA titrations of ABACUS1 in roots. Traces show ratio (DxAm/DxDm) changes of ABACUS1-2µ, ABACUS1-80µ and ABACUS1-nr roots in response to six 15-min pulses with increasing concentration of (±)-ABA. (±)-ABA pulses were raised in 5 × increments, from 0.2 µM to 625 µM. Inset shows the ABACUS1-2µ root at time zero with the region used for measurements outlined in yellow. ABA pulses are shown as grey areas and all ratios were normalized to time point 0. (C) Spatial distribution of ABA mediated responses. Ratio images showing pattern of ABACUS1-2µ in response to six (±)-ABA pulses as described above. Right: look up table used for false coloring of ratio images. Because ABACUS1 is stereospecific for (+)-ABA the effective ABA concentration available for sensing is ½ the (±)-ABA concentration.


