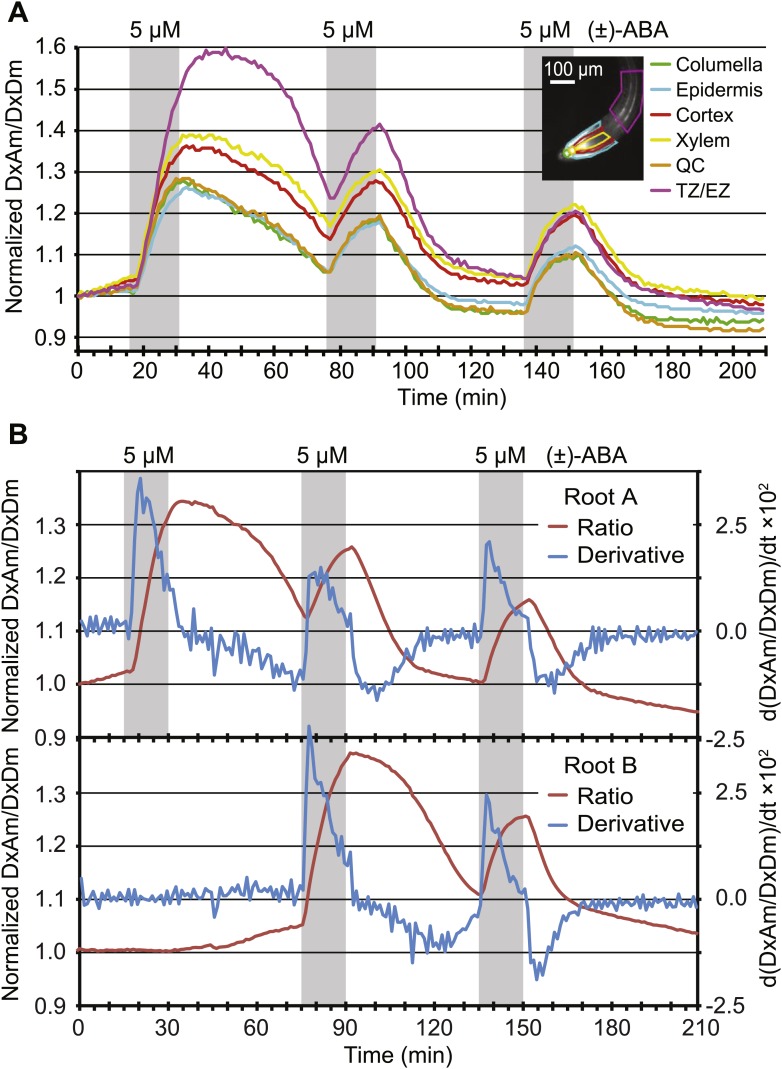
Figure 9. Dynamics of ABA uptake and elimination in roots as measured by ABACUS1-2µ.
(A) Spatial differences in the dynamics of ABA response. Traces showing ratio (DxAm/DxDm) changes in different root zones of an ABACUS1-2µ expressing root in response to three 15-min pulses of 5 µM (±)-ABA. The insert shows the root at time 0 with the regions used for the different zones outlined in the respective colors. (B) Temporal differences in ABA response dynamics. Red traces show ratio (DxAm/DxDm) changes of two ABACUS1-2µ roots from an experiment where roots were exposed to either three (Root A, upper) or two (Root B, lower) consecutive pulses of 5 µM (±)-ABA. The blue lines show the derivative of the respective traces (d[DxAm/DxDm]/dt) to aid in interpreting the dynamics of uptake and elimination. For all traces, (±)-ABA pulses are shown as grey areas and all ratios were normalized to time point 0. Because ABACUS1 is stereospecific for (+)-ABA, the effective ABA concentration available for sensing is ½ the (±)-ABA concentration.

