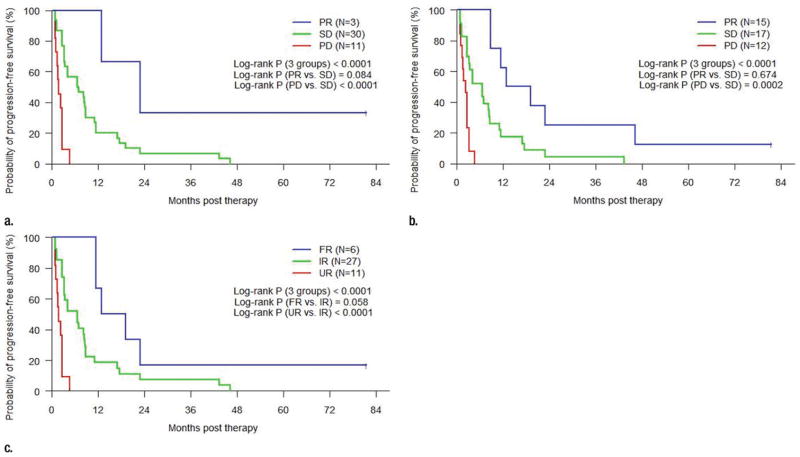
Figure 2.
Line graphs show Kaplan-Meier estimated progression-free survival in patients grouped by objective response at initial posttherapy CT imaging per (a) RECIST, (b) Choi criteria, and (c) MASS criteria. PR = partial response, SD = stable disease, PD = progressive disease, FR = favorable response, IR = indeterminate response, UR = unfavorable response.

