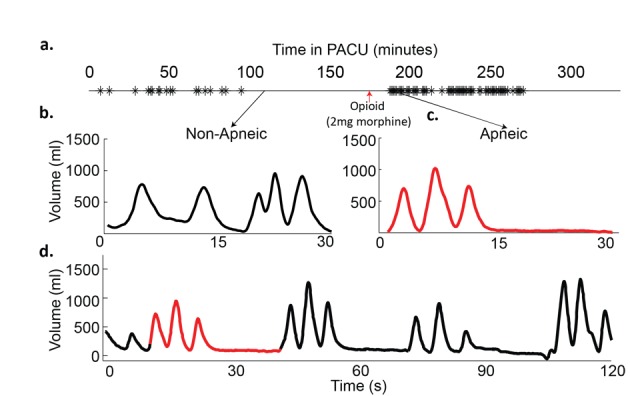
Figure 3.

Example traces from patient B. a) Timeline of patient’s stay in the post-anesthesia care unit (PACU), with each apnea/hypopnea plotted; b) 30 Second trace of normal breathing pattern before opioid administration (minute ventilation (MV) = 8.2 L/min, RR = 11, TV = 730 m); c) 30 second trace from an apneic time period after opioid administration (MV = 4.5 L/min, RR = 6, TV = 750 mL); d) 120 second trace from a period with repetitive apneas. (MV = 4.7 L/min, RR = 6.5, TV = 730 mL).
