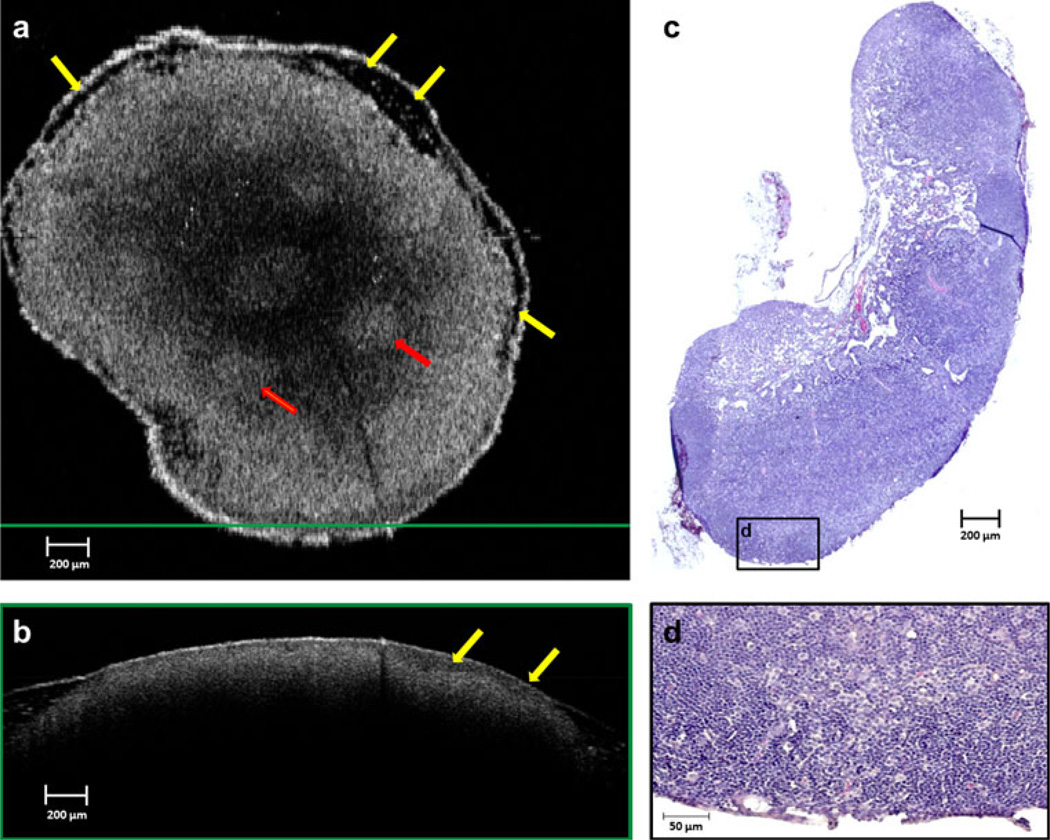
FIG. 4.
Lymph node imaged on day 5 after injection. A new heterogeneous low-scattering layer (yellow arrows) in the capsular and subcapsular region is prominent in both the en face (a) and cross-sectional (b) OCT images, and focal regions of higher scattering have become evident in the cortex (red arrows). The histological section corresponding to the en face OCT image is shown in (c). Infiltration of tumor cells and macrophages into the precortical region is visible in the magnified area (d) from the black-framed region shown on the histology section in (c)

