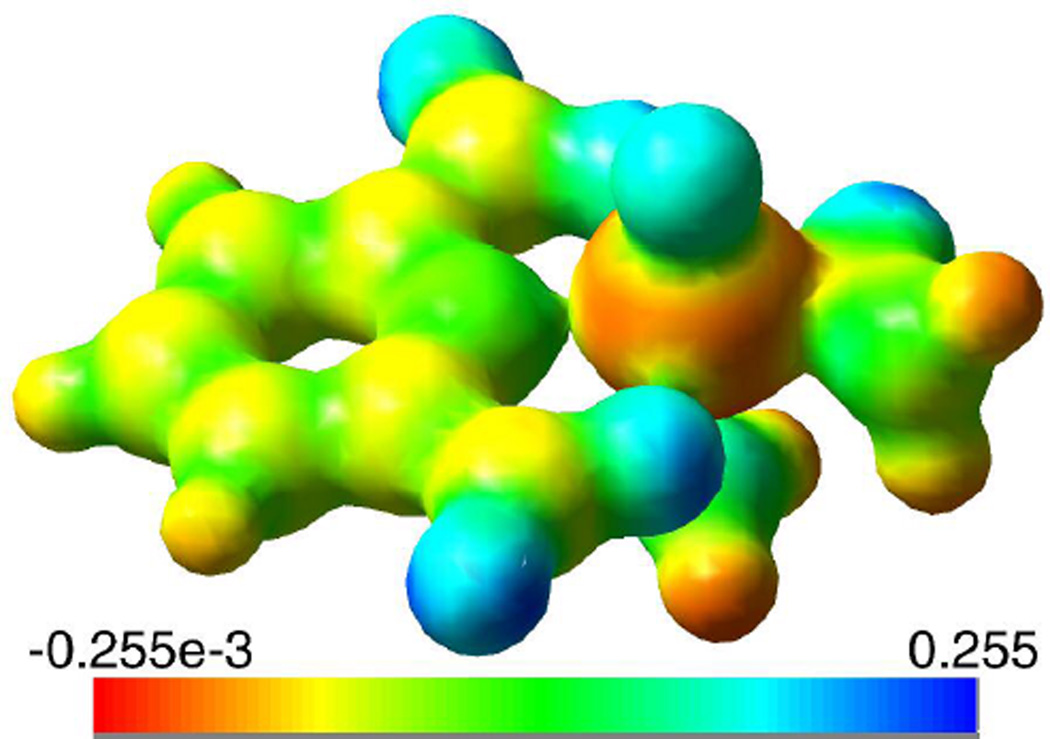
Figure 8.
An image of the electrostatic potential surface of [VO(dipic)(ONH2)(H2O)] (1) created from the total SCF density calculated in Gaussian. The regions of the positive charges are colored in blue while the regions of the negative charge are depicted in red. The color legend is shown at the bottom.

