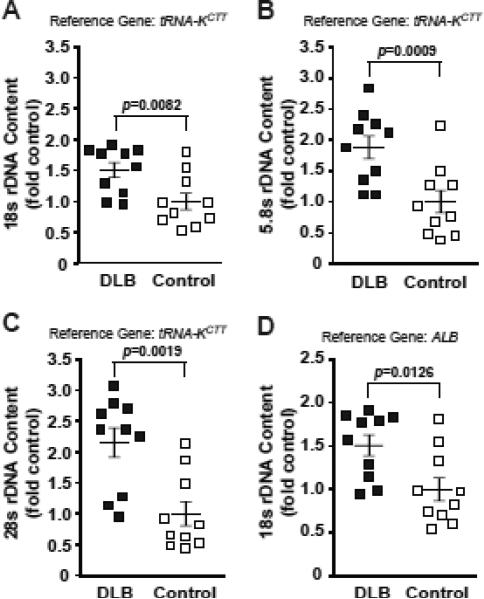
Figure 3. Increased rDNA content in the DLB parietal cortex.
Genomic rDNA content was quantified in post mortem samples of the parietal cortex from DLB- and age-matched control individuals without any neurodegenerative conditions (n=10 each). The 18S-, 5.8S- and 28S amplicons were used for the determinations; the reference genes are indicated. Regression analysis of individual values for pairs of rDNA amplicons revealed strong correlations similar to those in Fig. 2A (see the Results section for more details). In the DLB group, significant increases of rDNA content were detected using the 18S/tRNAK-ctt (A), 5.8S/tRNAK-ctt (B), 28S/tRNAK-ctt (C) and 18S/ALB (D) ratios. Individual values are depicted by squares; mean values are indicated by the lines intersecting the error bars (SEM); p values of the Kruskal-Wallis ANOVA are shown.

