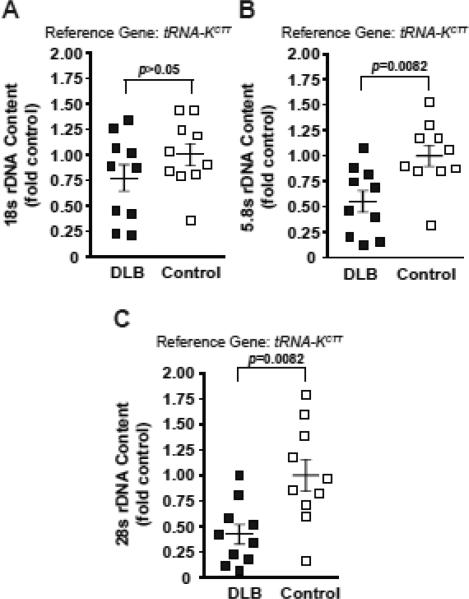
Figure 4. Decreased rDNA content in the DLB cerebellum.
Genomic rDNA content was quantified in post mortem samples of the cerebellum from 10 DLB- and 10 aged-matched control individuals. Regression analysis of individual values for pairs of rDNA amplicons revealed strong correlations similar to those in Fig. 2A (data not shown). While a downward trend was observed for the 18S amplicon (A), the 5.8S- and the 28S probes revealed significant decreases of rDNA content in DLB samples (B-C). Individual values are depicted by squares; mean values are indicated by the lines intersecting the error bars (SEM); p values of the Kruskal-Wallis ANOVA are shown.

