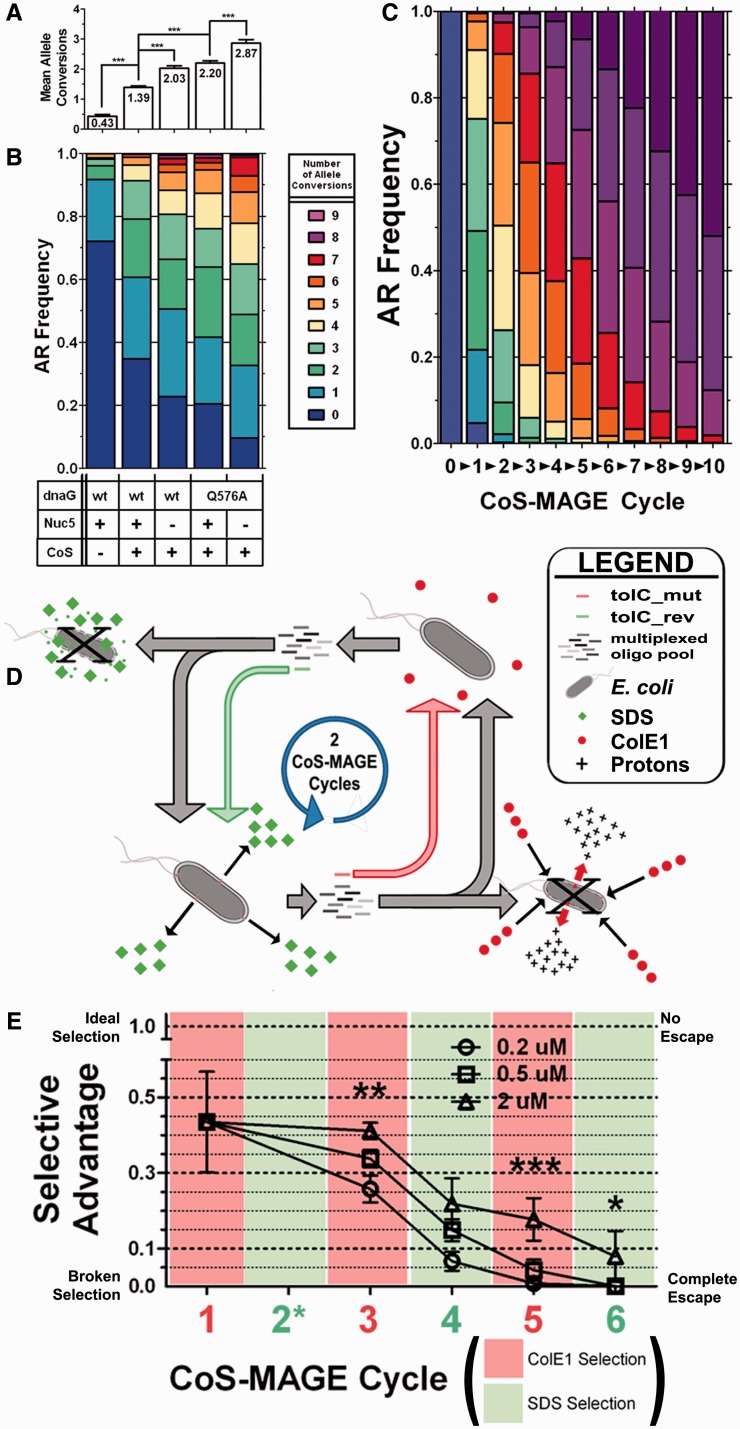
Figure 1.
Repetitive tolC counter-selection rapidly generates a dysfunctional phenotype. (A and B). To motivate our work and demonstrate CoS-MAGE in improved strains, we averaged allele conversion data from recent studies (22,23) across 30 genomic loci [Sets 1–3 from (22,23)]. The data are reported as (A) Mean Allele Conversion ± SD of each population (n = 212, 821, 538, 561, 330, respectively) with the population mean reported within its respective bar, and (B) as a stacked bar graph where each color indicates the frequency of clones bearing that number of allele conversions. (C). The data from strain EcNR2.Nuc5-.dnaG_Q576A were used to model the allele conversion distribution through 10 cycles of CoS-MAGE. This model did not account for any positional dependence for conversion of certain pairs of alleles (See Supplement and Figure S2). (D). A workflow diagram showing how the dual selectable marker, tolC, can be used for CoS-MAGE. Starting in the bottom left corner, the tolC+ genotype is recombined with a multiplexed oligo pool (gray oligos) plus the tolC_mut inactivation oligo (red). tolC− recombinants pass subsequent counter-selection in colE1, whereas the parental genotype is killed off (bottom right corner). Counter-selected tolC− population (top right corner) is then recombined with a multiplexed oligo pool (gray oligos) plus the tolC_rev reactivation oligo (green). tolC+ recombinants pass subsequent tolC selection (bottom left corner), whereas the parental tolC− genotype is killed (top left corner), and thus completes a tolC selection/counter-selection cycle (2 CoS-MAGE cycles). (E). Selection performance of CoS-MAGE cycling on EcNR2.2223749::tolC using three different concentrations of the selectable oligo (0.2, 0.5 and 2 µM) and the same concentration of the multiplexed, nonselectable oligos (5 µM), quantified as Normalize Selective Advantage (NSA, described in ‘Materials and Methods’ section) and presented as mean ± St. Dev. (n = 5+). Statistical significance was tested using a Kruskal–Wallis One-way ANOVA followed by Dunn’s test, where *P < 0.05, **P < 0.01 and ***P < 0.001. The plot background color indicates the selection (green) or counter-selection (red) step associated with that CoS-MAGE cycle. Over successive CoS-MAGE cycles, all three lineages escaped and NSA → 0.

