Figure 2.
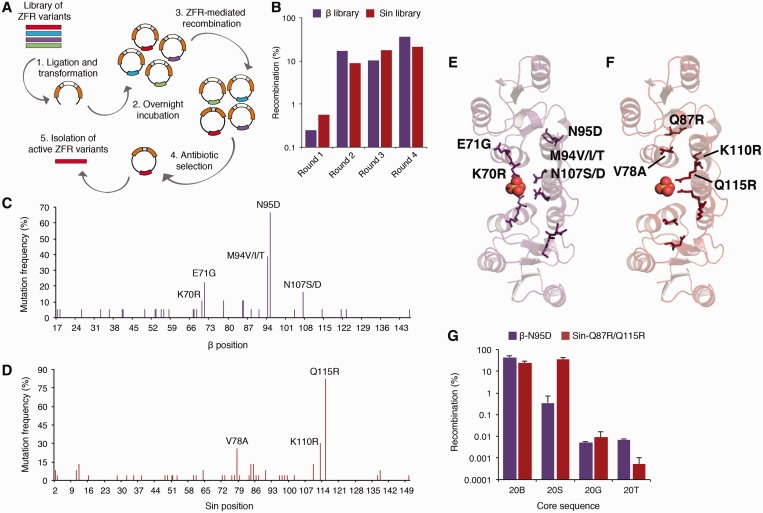
Directed evolution of enhanced β and Sin catalytic domains. (A) Schematic representation illustrating the split gene reassembly selection strategy. ZFR variants are shown in various colors; β-lactamase gene is in orange and GFPuv gene is in white. (B) Selection of β and Sin variants that recombine minimal core sites from the six and resH recombination sites, respectively. (C, D) Frequency and position of the mutations that activate the (C) β and (D) Sin catalytic domains. Highly recurrent mutations are indicated. (E, F) Crystal structure of the activated Sin-Q115R tetramer; view of dimer interface from above the N-terminus of the E helix (PDB ID: 3PKZ) (51). Highly recurrent (E) β and (F) Sin mutations shown as sticks and mapped onto the rotated Sin dimer, residues labeled on upper monomer only. Sulfate ion shown as spheres. (G) Recombination activity of β-N95D and Sin-Q87R/Q115R on the 20B, 20S, 20G and 20T core sequences. Recombination was determined by split gene reassembly. Error bars indicate standard deviation (n = 3).

