
Figure 4.
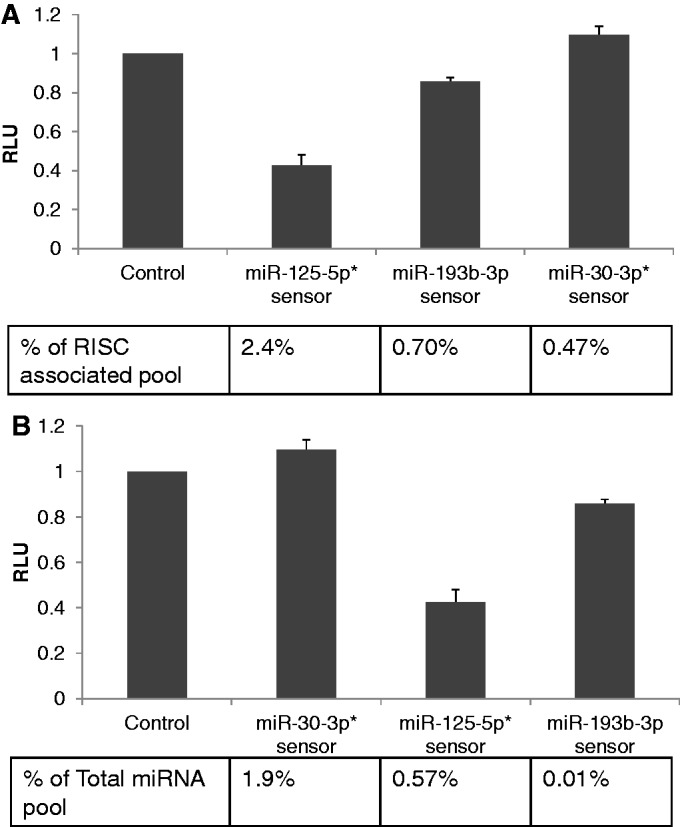
MiRNA inhibitory potential in A549 cells correlates with the RISC-associated miRNA level. (A) Sensor constructs were generated by the insertion of three copies of a predicted full-length miRNA target site, bearing a bulge opposite to miRNA nucleotides 10 and 11, for miR-125-5p, miR-193b-5p and miR-30-3p. The sensor constructs were transfected into A549 cells and cells were harvested 24 h later and RLuc and FLuc (internal control) activities determined. Data are expressed relative to the value for the control construct, which was set at 1. The observed level of inhibition was then plotted relative to the observed level of the individual miRNA analysed in the RISC-associated miRNA pool, given as a percentage. The values shown represent the average of three independent experiments, with s.d. indicated. (*)Note that the miR-125-5p sensor will detect both miR-125a-5p and miR-125b-5p while the miR-30-3p sensor will detect both miR-30a-3p and miR-30e-3p. The reads for these two sets of two miRNAs are therefore independently summed in this analysis. (B) Same experiment as A but plotted in the order of the miRNA expression level observed in the total small RNA pool.