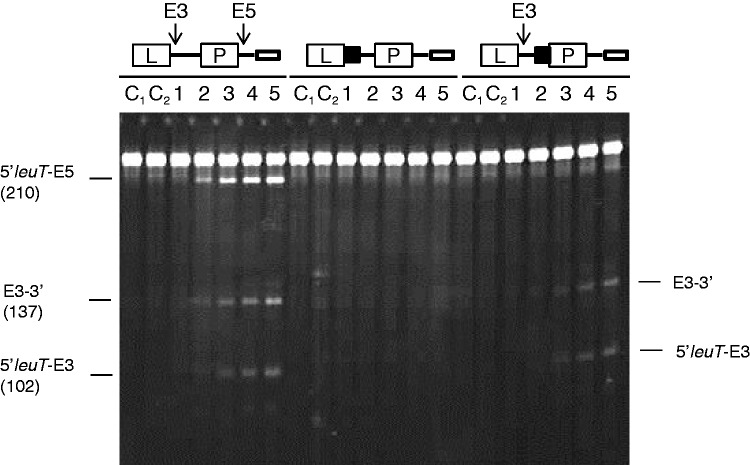
Figure 3.
The requirements for direct-entry cleavage at E5. The 5′-triphosphorylated substrates incubated with T170V are shown schematically at the top of the panel. Closed black boxes indicate the binding sites to two complementary oligonucleotides used to block cleavage. Only sites at which cleavage occurs are indicated. Their precise locations are shown in Supplementary Figure S4. The transcript in each case started at the 5′ end of leuT tRNA. As Figure 2, lanes 1–5 contain samples taken 0, 5, 15, 30 and 60 min after mixing substrate and enzyme, whereas lanes C1 and C2 correspond to substrate incubated without enzyme for 0 and 60 min. Enzyme and initial substrate concentration and staining of products as Figure 2. The labelling on the right and left indicates the species produced in the presence and absence of oligonucleotide binding to a segment encompassing E4.

