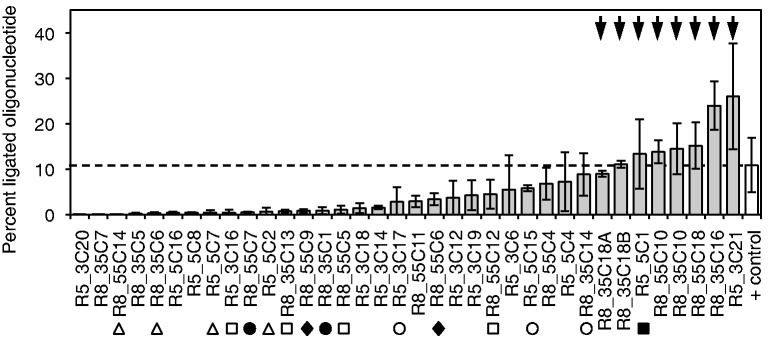
Figure 2.

Screen of 36 in vitro selected RNAs for self-triphosphorylation activity, using an assay based on the R3C ligase ribozyme (see Supplementary Figure S4). The column heights show the percent of 5′-[32P]-radiolabeled oligonucleotide that was ligated to the individual selected RNAs by the ligase ribozyme, after the selected RNAs were incubated with TMP for 3 h to allow for self-triphosphorylation. Therefore, the percent of ligated oligonucleotide was an indirect measure of self-triphosphorylation activity. As positive control, the unselected RNA pool was ligated to the radiolabeled oligonucleotide, facilitated by a 5′-triphosphate that was incorporated during transcription (white column and horizontal dashed line). The labels on the x-axis denote the clone names (round of isolation_branch of the evolution_clone number). The clones were sorted according to the average percent of ligated oligonucleotide. The sequences of all 36 clones are shown in Supplementary Figure S3. Classes of related sequences are indicated by symbols, with empty squares (class 1), empty triangles (class 2), empty circles (class 3), filled circles (class 4), filled squares (class 5) and filled diamonds (class 6) each belonging to one class. Class 5 is represented by a single clone because the second clone had the identical sequence. No other clone showed related sequences among the 36 clones. The eight clones with the highest activity (arrows) were chosen for further analysis. Error bars are standard deviations from three independent experiments.
