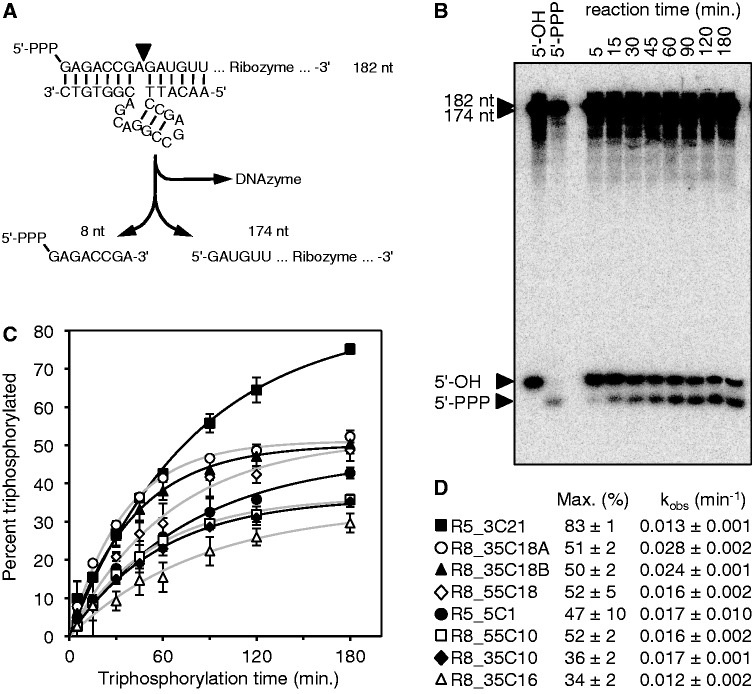
Figure 3.
Kinetic analysis of the eight most promising ribozyme clones. (A) Schematic of the assay using the 8–17 DNAzyme. After reaction with TMP, internally [32P]-radiolabeled ribozymes were cleaved by the DNAzyme. This freed the eight 5′-terminal nucleotides, facilitating gel separation of triphosphorylated and unreacted RNAs. (B) Autoradiogram of products after the DNAzyme reaction and separation by denaturing 22% PAGE. An RNA that was not exposed to TMP (5′-OH) and an RNA that was transcribed with a 5′-terminal triphosphate (5′-PPP) were used as negative and positive controls, respectively. The incubation times with TMP are indicated on the top. The long fragment of the cleaved ribozymes (174 nt) and possible remaining uncleaved ribozymes (182 nt) migrated much slower than the 8-nt fragments. The 8-nt fragments were separated based on their phosphorylation status. The particular autoradiogram was from analysis of clone R8_35C18A. (C) Determination of triphosphorylation kinetics from signals as shown in (B). The percent of triphosphorylation of the 8-mer was plotted as function of the incubation time with TMP. Single-exponential fits are shown as black or gray lines. Error bars are standard deviations from three experiments. Symbols are explained in (D). Single-exponential curve fits are shown in black lines for filled symbols and gray lines for empty symbols. (D) Symbols and clone names used in (C), together with the parameters obtained by curve fits, the maximal percentage of reacted ribozyme (Max.) and the observed pseudo-first order rate constant (kobs).

