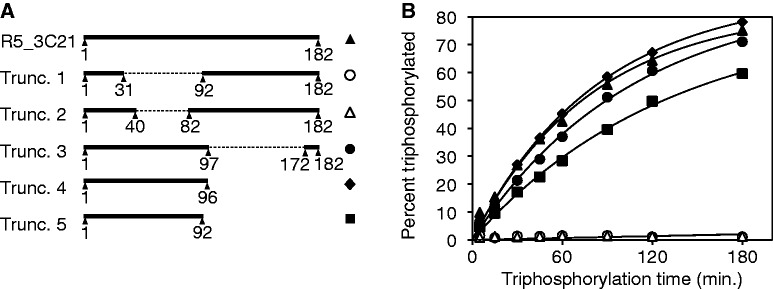
Figure 4.

Truncation analysis of the ribozyme clone R5_3C21. (A) Schematic of the tested truncations. The numbering is relative to the complete sequence of the 182-nt long initial isolate (Supplementary Figure S3). Dotted lines indicate internal segments that were removed. Symbols to the right of each construct are consistent with the symbols in (B). (B) Triphosphorylation kinetics for the initial isolate and five truncated sequences. The kinetics was determined with the DNAzyme assay (Figure 3). Black lines represent single-exponential curve fits to the data. The symbols of truncations 1 and 2 are overlapping near the x-axis.
