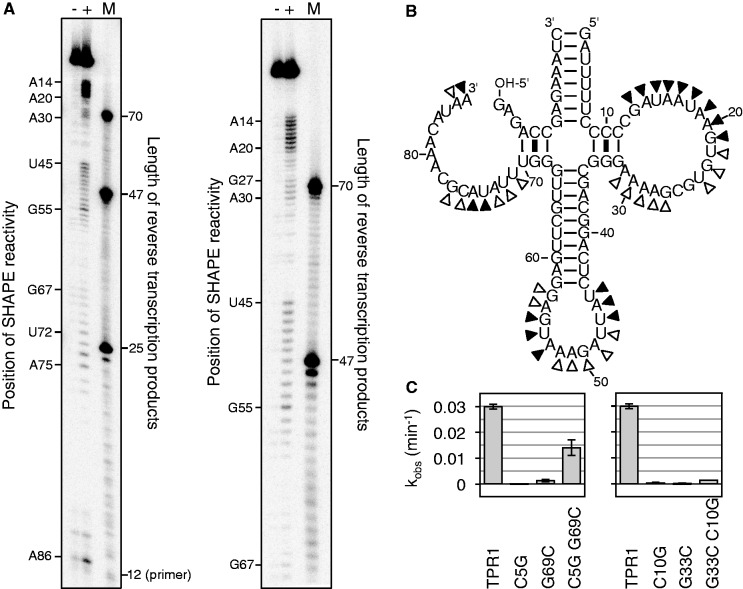
Figure 6.
Secondary structure analysis for the trans-triphosphorylating TPR1 ribozyme. (A) Autoradiograms of SHAPE analysis products, after reacting the ribozymes with 1M7 and subjecting them to reverse transcription with a 5′-[32P]-radiolabeled primer. The left image shows a separation by 20% PAGE to separate short products, whereas the right image shows a separation by 10% PAGE to show the longer products. Each image shows three lanes, where (−) denotes a negative control with DMSO, (+) denotes the SHAPE reaction with 1M7 dissolved in DMSO and M denotes a marker lane with three 5′-radiolabeled DNAs that have the identical sequence as the expected reverse transcription products. The primer has a length of 12 nt, base paired to 12 nt that were appended to the ribozyme 3′-terminus. The SHAPE signal is shifted by one nucleotide relative to the length of the reverse transcription product because the reverse transcriptase stops at the nucleotide before the SHAPE modification. (B) The secondary structure was based on two types of analysis. Filled triangles indicate a strong signal from SHAPE analysis, whereas empty triangles indicate weaker signals. (C) Two base pairs suggested by the SHAPE data were tested by single mutations of each base partner, and double mutation that should have restored activity for correct base pairs. The observed reaction rate was determined as in Figure 5 and given for each mutant.

