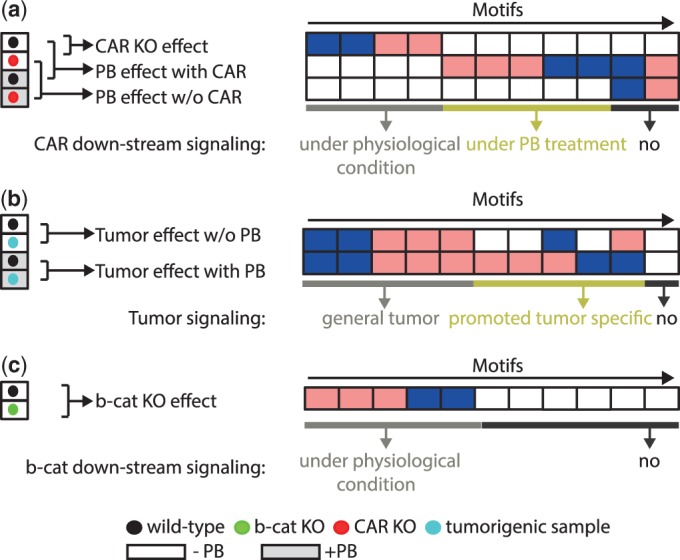
Figure 2.

Schematic representation of contrasts applied for differential motif activity analysis of each dataset. The color of the dot indicates whether the sample is WT (black), β-catenin KO (green), CAR KO (red) or tumor (blue). White boxes correspond to control samples and gray boxes to PB-treated samples. The arrows show which pairs of samples are compared for each contrast and point to corresponding rows with example motif activity changes (blue corresponding to downregulation  , pink to upregulation
  and white no significant change
  ). (a) Motif activities from the CAR KO study are compared to identify regulators downstream of the CAR pathway under physiological conditions and under PB treatment. (b) Motif activities from the tumor study are compared to identify promoted tumor-specific regulators. (c) Motif activities from the β-catenin KO study are compared to identify downstream regulators of the β-catenin pathway under physiological conditions.
