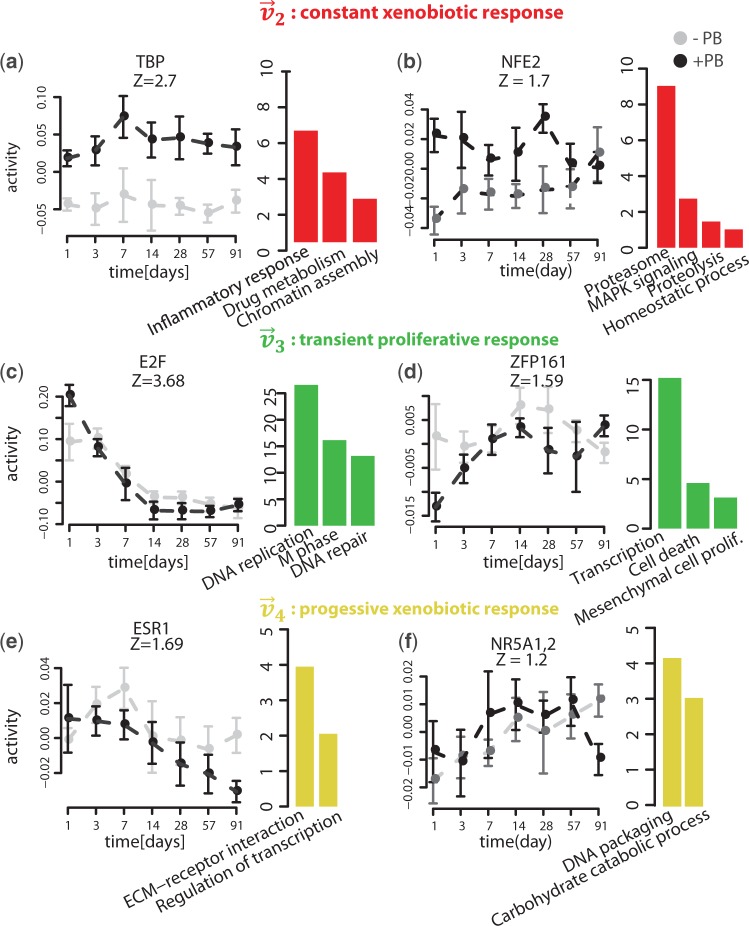
Figure 4.
Examples of motif activity profiles that are associated with the constant xenobiotic response (a,b), the transient proliferative response (c,d) and the progressive xenobiotic response (e,f). For each motif, a z-value is indicated that quantifies the overall significance of the motif in the early kinetic dataset. In addition, for each motif a selection of biological pathways and functional categories (Gene Ontology or KEGG) that are enriched among target genes is plotted to the right of the activity profile. The size of each bar corresponds to the significance  of the enrichment.

