Figure 1.
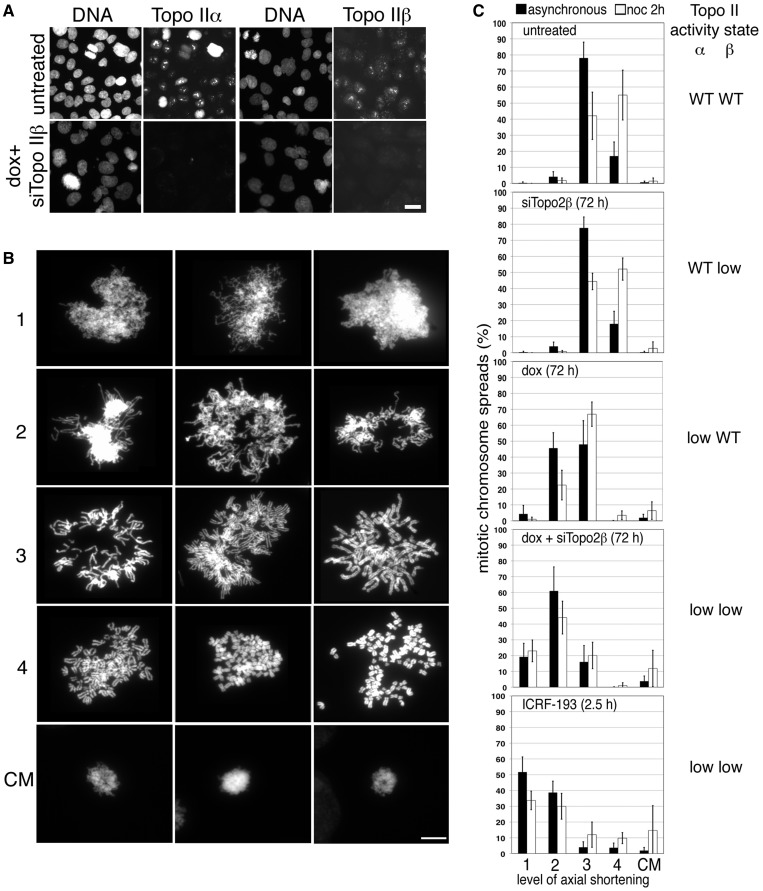
The effect of depleting the two topo II isoforms on mitotic chromosome formation. (A) Indirect IF of topo IIα and topo IIβ in HTETOP cells either untreated or exposed to dox (topo IIα depletion) + siTopo IIβ for 3 days. Cells were fixed in situ using PTEMF. Topo II was detected using either anti-topo IIα or anti-topo IIβ antibody (FITC) and DNA counterstained using DAPI. Scale bar, 25 µm. (B) Representative images of DAPI-stained chromosome spreads assigned to various levels (1–4) of axial shortening are shown, together with examples of compact chromatin masses (CM). Scale bar, 10 µm. (C) Frequencies of the various levels of axial shortening observed in mitotic HTETOP cells expressing normal levels of both topo II isoforms compared with cells depleted of either topo IIα or IIβ, or both, over 72 h, or cells in which both isoforms have been chemically inhibited for 2.5 h (ICRF-193). Cells were grown on slides overnight, treated with hypotonic (75 mM KCl, 10 min) before fixation in ice-cold methanol: acetic acid and examined after DAPI staining of the DNA. Data were collected both from asynchronously growing populations and from cells arrested in M-phase (nocodazole 2 h). Data points represent the mean (±standard deviation (sd)) based on ≥3 independent experiments, with ∼100 cells scored per experiment.

