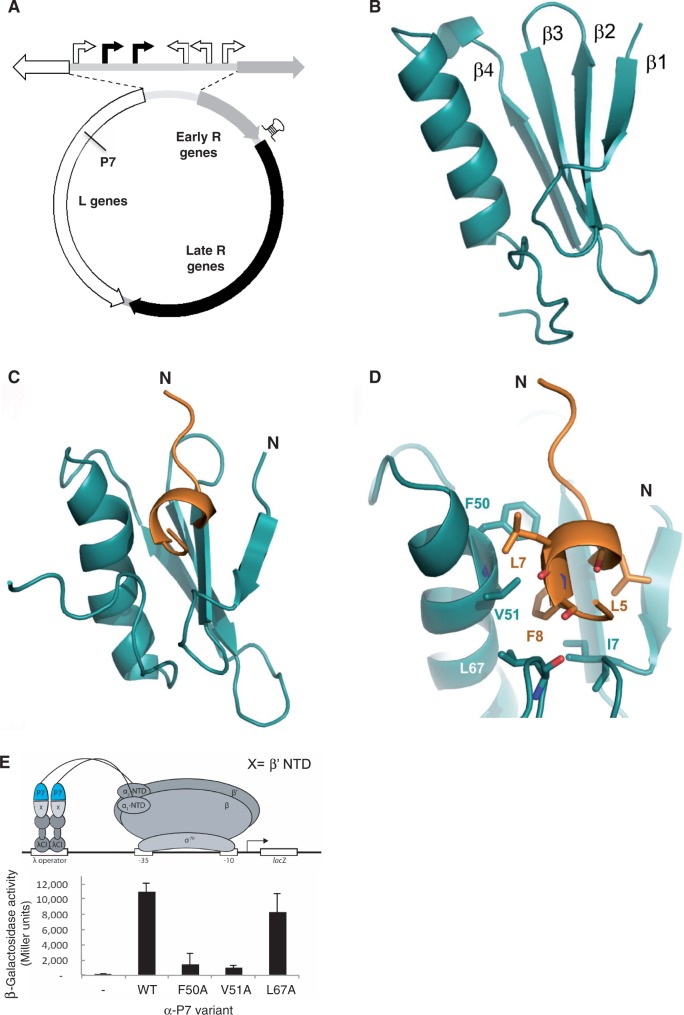
Figure 1.
The solution structures of P7 and P7-β’ NTD complex. (A) The groups of Xp10 genes that belong to the different temporal classes are indicated on the Xp10 genome (shown in circular organization). The host (white arrows) and phage (black arrows) RNAp dependent promoters in the intergenic region separating the L genes and early R genes are shown at the top. In the L genes, the approximate location of the gene-encoded P7 is indicated and the putative transcription terminators that separate early and late R genes are indicated by a hairpin (see text for details). This figure has been adapted from Djordjevic et al. (12). (B) Cartoon representation of the solution structure of apo P7 showing the juxtaposition of the α helix and the β1 -β2-β3-β4 sheets. (C) Solution structure of P7 in complex with the first 10 aa residues of the β’ subunit from Xo RNAp (β’ NTD). P7 is shown in cyan and β’ NTD in orange. The position of N-termini for each chain is indicated. (D) Zoomed cartoon representation of the P7-β’ NTD complex showing residues located in the P7-β’ NTD binding site. Key interacting residues are labelled. (E) BTH interaction assay used to detect protein–protein interaction between β’ NTD and mutants of P7. The diagram depicts how the interaction between β’ NTD, fused to the bacteriophage λ CI protein (λCI), and P7, fused to the α-NTD (α-P7), activates transcription of the lacZ gene. Results of the β-galactosidase assays expressed in Miller units are shown in the bar chart.

