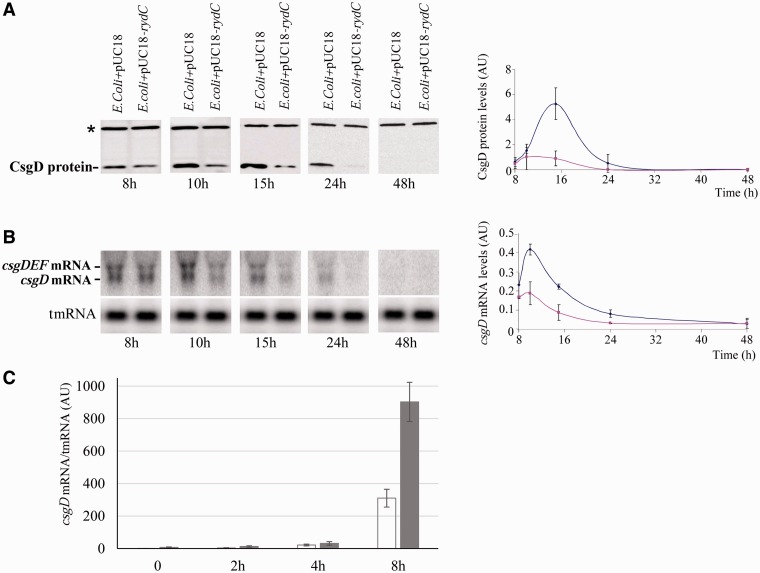
Figure 3.
RydC lowers csgD mRNA and protein levels and the absence of endogenous levels of RydC increases csgD mRNA synthesis during curli formation. (A) Immunoblots with anti-CsgD antibodies monitoring CsgD protein expression between 8 to 48 h curli formation on YESCA agar plates at 28°C in an E. coli strain harbouring pUC18-rydC versus an isogenic strain containing the empty plasmid (E. coli+pUC18). The asterisk indicates an aspecific protein revealed by the antibody. The graph shows CsgD protein quantification in the two isogenic strains (E. coli+pUC18 is blue; E. coli+pUC18-rydC is pink, Arbitrary Units, AU) relative to the amount of the aspecific protein. (B) Northern blot analysis of the csgD and csgDEF mRNAs in the two strains during curli formation at time points, as in panel A. The blots were also probed for tmRNA as loading internal controls. The graph shows csgD mRNA quantification in the strains relative to tmRNA (similar colour code as in panel A, Arbitrary Units, AU). (C) The qPCR comparison of csgD mRNA expression in E. coli (white) and E. coli-ΔrydC (dark grey) strains during curli formation for 8 h on YESCA plates, normalized against the tmrna reference gene (Arbitrary Units, AU). The downregulation of csgD mRNA by RydC occurs after 4 h of incubation.

