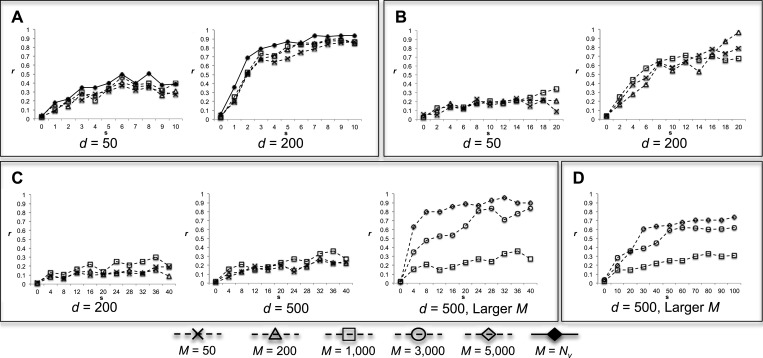
Figure 4.
The ratio r that EDDY identifies  with P
 , of 100 repetitions. (A)
  variables, (B)
  variables, (C)
  variables, and (D)
  variables.
  was used for all cases. Note that the cases of
  correspond to false positives as both
  and
and  are derived from the same network, and those of
  correspond to true positives.

