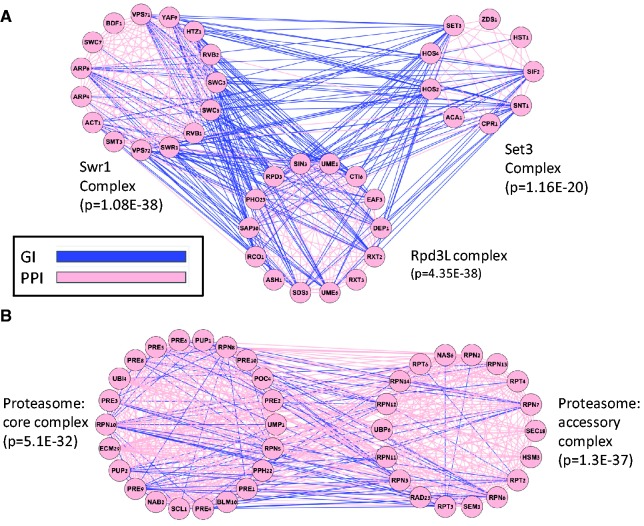
Figure 3.
Examples of linked modules in the yeast module map. The genes of each module are arranged in a circle. Blue edges represent negative GIs and pink edges represent PPIs. For each module, the most enriched GO term is shown along with its enrichment P-value. (A) Linkage among different protein complexes. The significance of the links between Rpd3L and the Set3 complexes and between Swr1 and Rpd3L complexes is <10E-70. The link between Swr1 and Set3 is also highly significant (P = 4.29E-59). (B) Detection of subcomplexes. The joint analysis of the PPI and GI networks partitions the proteasome complex into its two subcomplexes: the accessory and the core complex.

