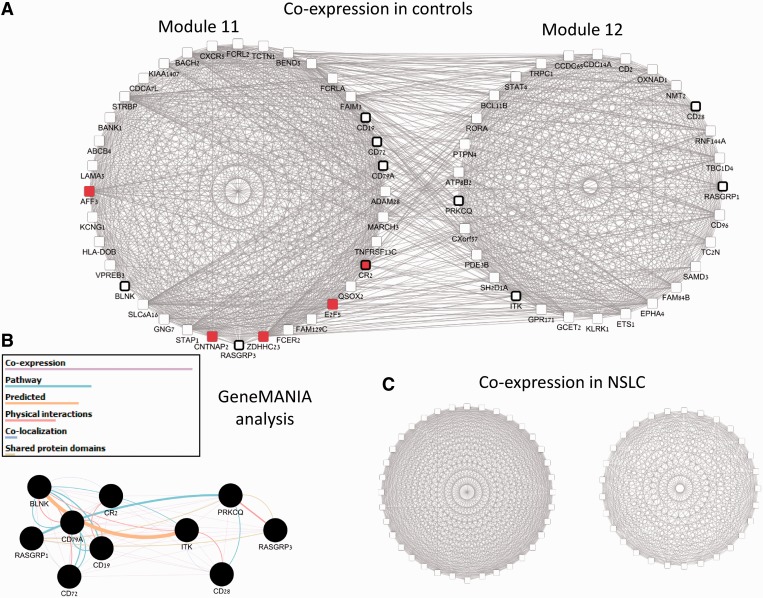
Figure 5.
A pair of immune activation-related modules differentially correlated in NSCLC. (A) Two-linked modules, which are a part of the constructed module map. Nodes are genes and edges represent correlation >0.4 between the genes in the expression patterns of control class. Edges here correspond to high co-expression between two genes and do not reflect the weights in the CC or DC networks. We observe strong co-expression both within and between the modules. Nodes with black frames are related to immune activation response (six T-cell activation genes in module 11 and four B-cell activation genes in module 12). Red nodes in module 11 are targets of mir-34 family. (B) GeneMANIA analysis of the T-cell and B-cell signaling pathway genes shows that the genes of both modules are expected to interact in healthy controls. (C) The same two modules and their co-expression network in the NSCLC class. As in A, the genes within each module are highly co-expressed. In contrast to A, co-expression between the modules is completely diminished.

